HOME > 写真 > イラスト・CG > CG > 3DCG
10,000件の写真素材が検索されました。
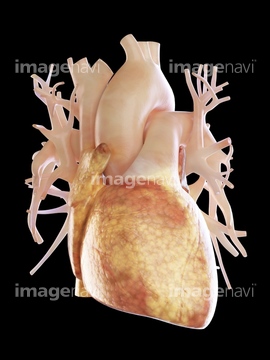
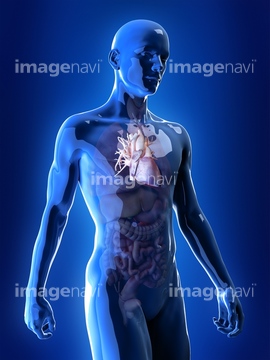
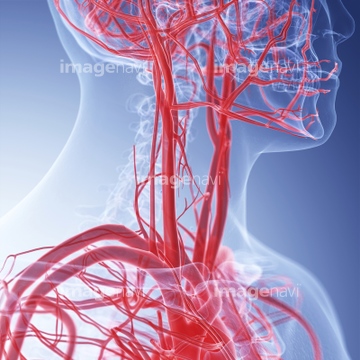
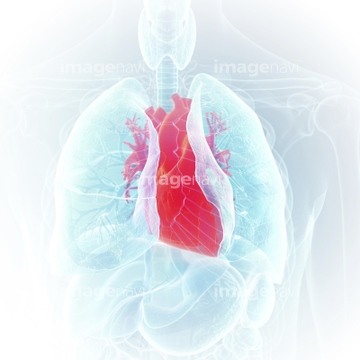
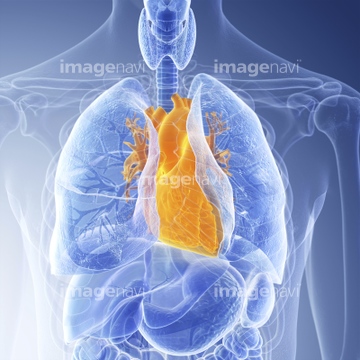
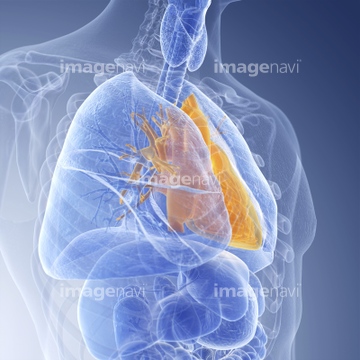
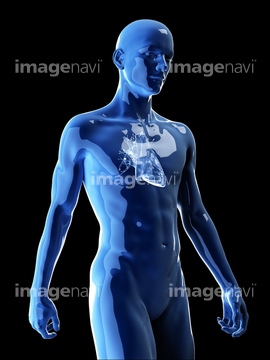
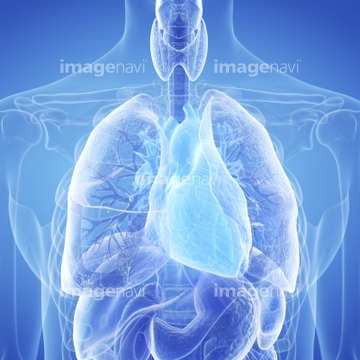
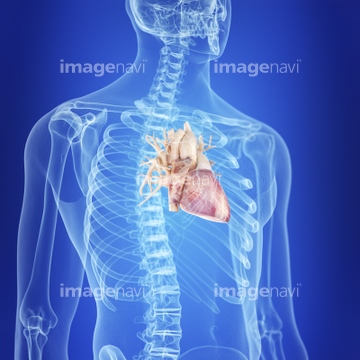
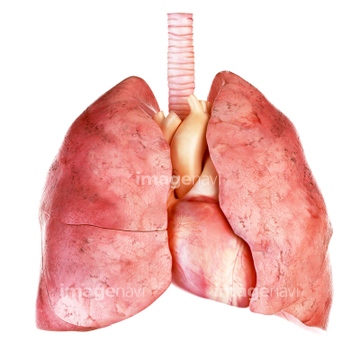
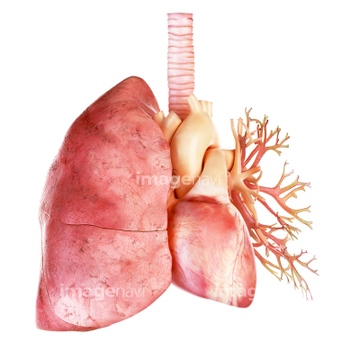
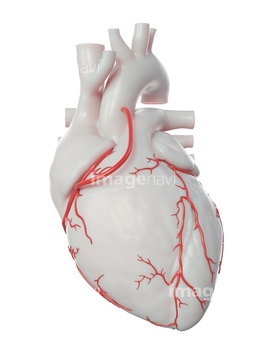
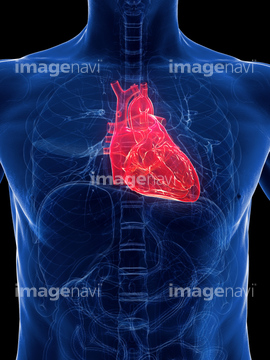
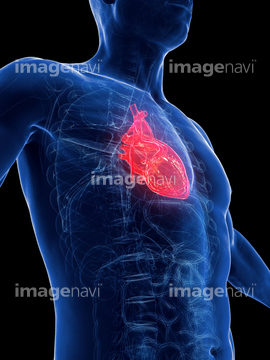
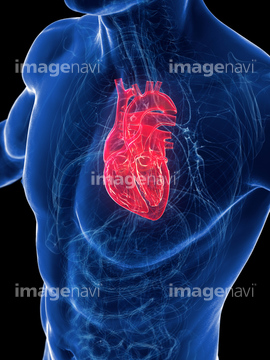
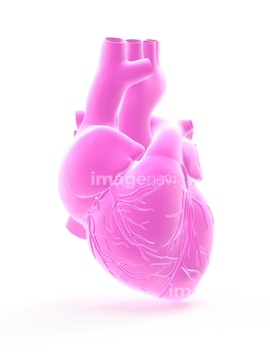
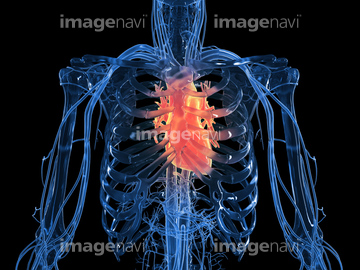
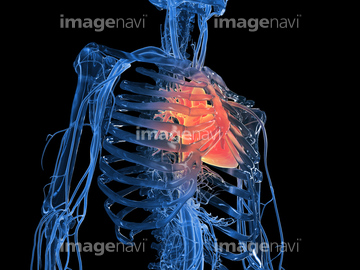
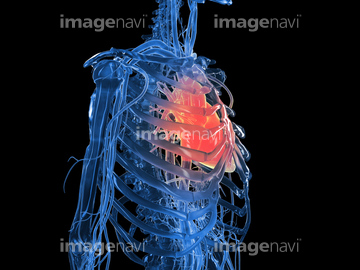
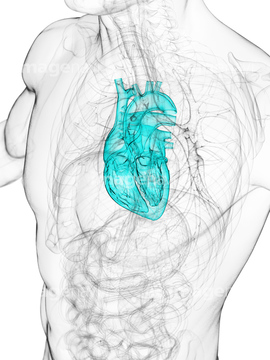
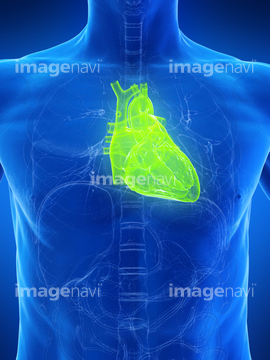
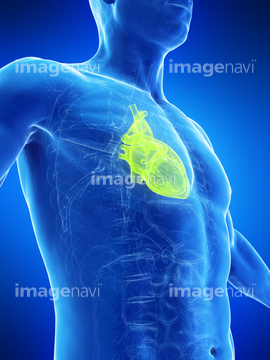
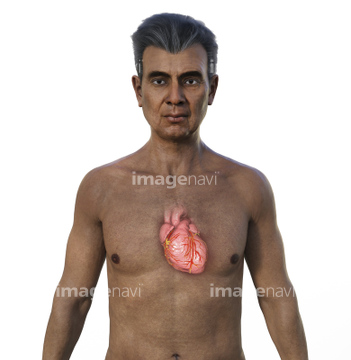
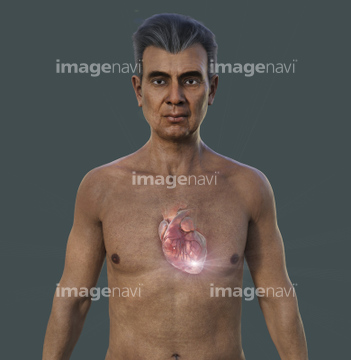
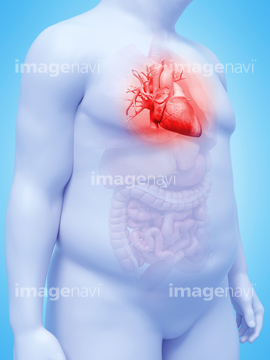
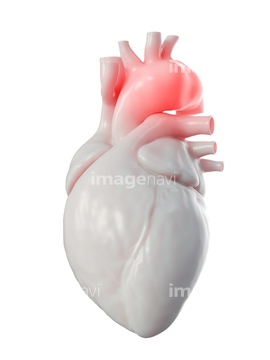
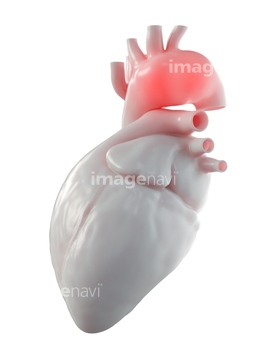
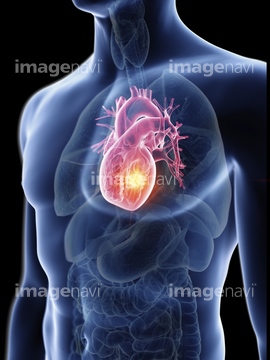
この検索結果には、Illustration of a healthy heart、Illustration of the human heart and lung、Illustration of a bypass、Illustration of 2 bypasses、Illustration of 3 bypasses、Illustration of the human heart anatomyなどが含まれています。
17289003
17289000
17289001
17289002
64255569
17285801
17285862
17285863
17285864
17288490

17288505
17288552
17288553
17288554
17288569
17288609
17288674
17289246
17287680
17287681
17288158
64245048
20507021
64222120
17202034
17202035
17202036

20576276
20575930
17287660
17285708
17285725
17288555
17288556
17288557
17288610
17288711
17288712
17288715
17288716
17288717
17288718
17287655
17287656
17287657
17287658
17287659
17202037
20551254
20551255
20551256
20551257
20551258
20551259
20551260
20551261
20551262
20551263
20551264
20551265
20551266
20551267
20551268
20551269
20551270
20551271
20551272
20551273
20551274
20551275
20551276
20551277
20576277
20576282
64222125
64222136
64222141
64222145
64222149
64222156
20578145
20578190
20578276
20578285
64122827
64122828

64122830
64122833
64122838
20579721
20579722
20579723
20579724
20579725
20579727
20579729
20579730
20579731
17285744
17285771
17285780
64222122
64222133
64222139
64222140
64222142
64222153
17285849
17285850
17285851
20550251
20550252
20550253
20550254
20550255
20550256
20550257
20550258
20550259
20550260
20550261
20550262
20550263
17277958


17262057
17246339
17259035
17259179
20576896
20576899
20578166
20578217
20578296
20579272
20579273
20579362
64200950
64200951
20578072
20578095
20578164
20578207
20576301
20576302
17289705
17207953
17207992
17208023
17289351
17287653
17287654
17287892
17287893
17287909
17278739
| 次ページ |
