HOME > 写真 > 医療・福祉 > 医療 > 病院・クリニック
10,000件の写真素材が検索されました。
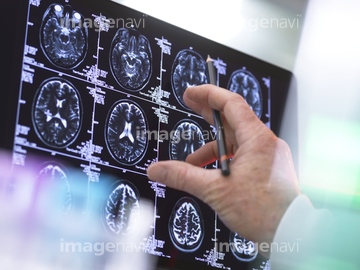
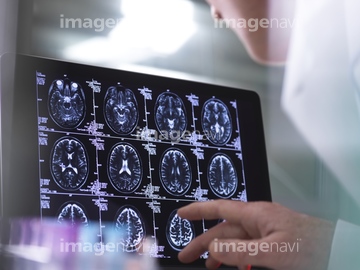
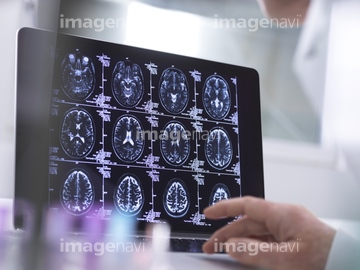
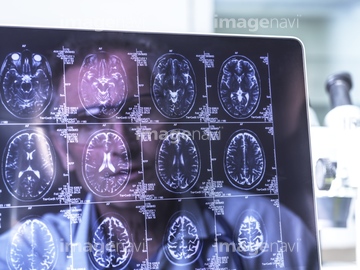
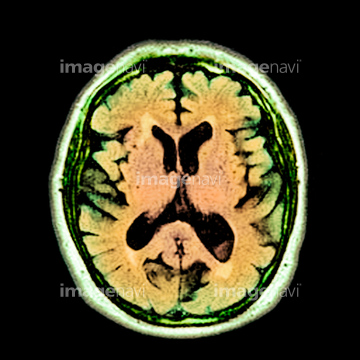
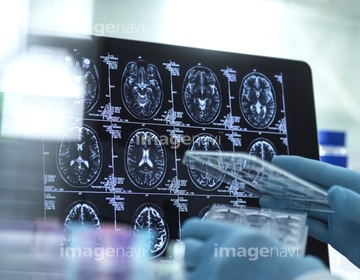
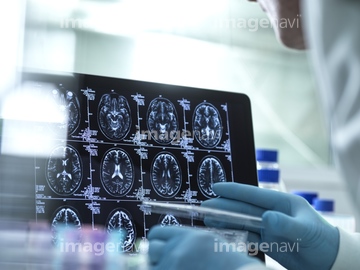
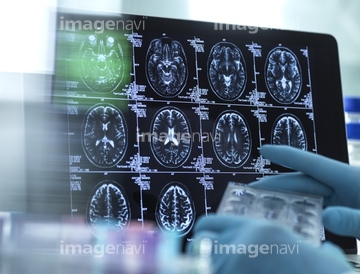
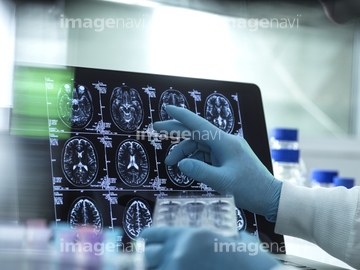
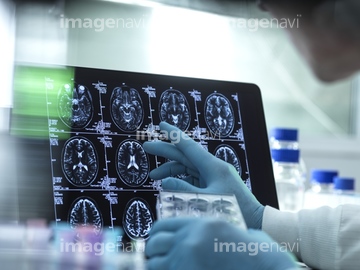
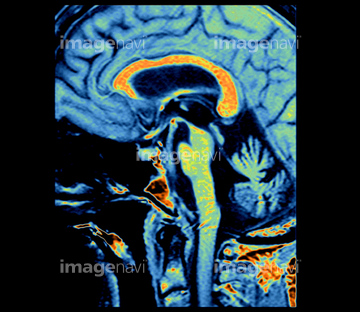
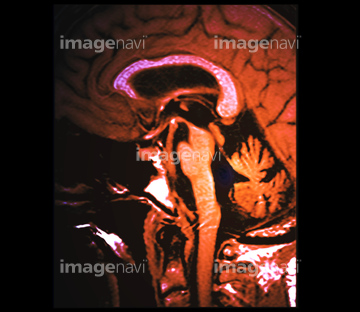
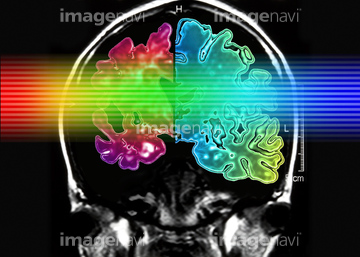
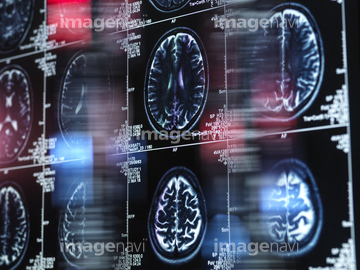
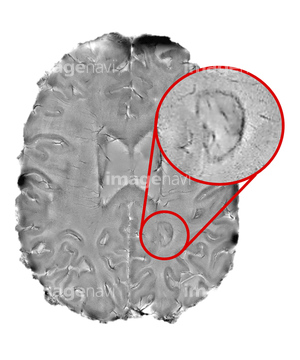
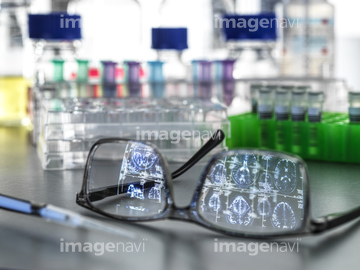
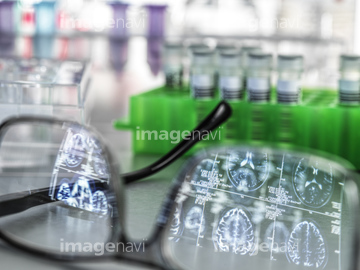
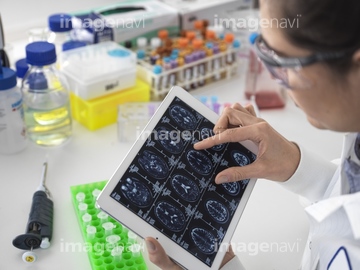
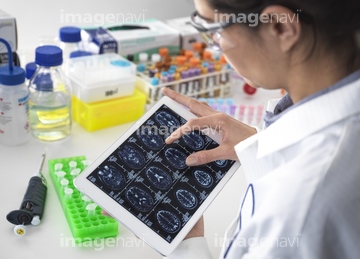
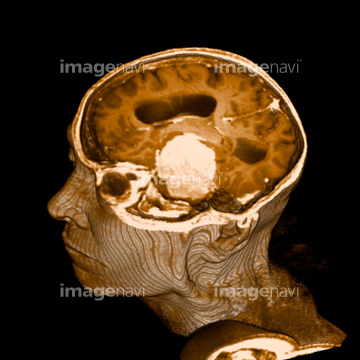
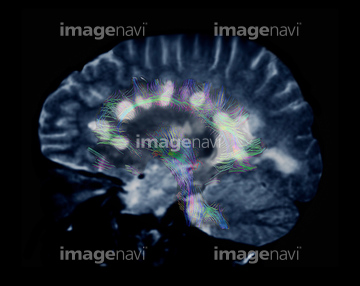
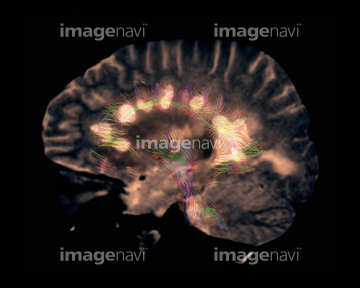
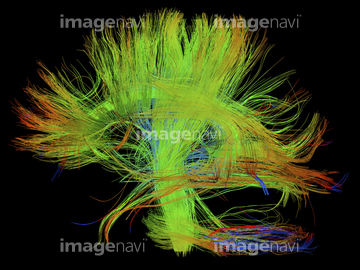
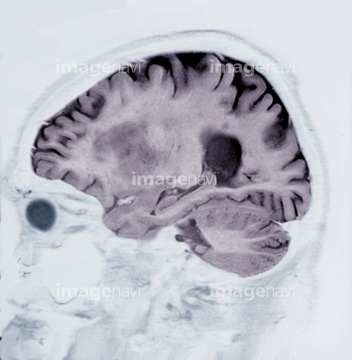
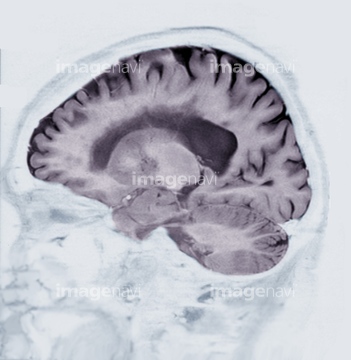
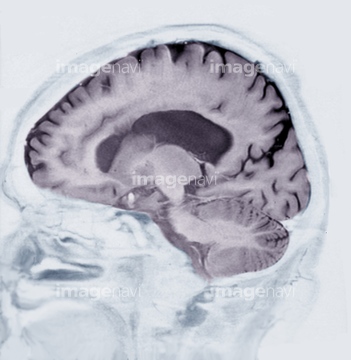
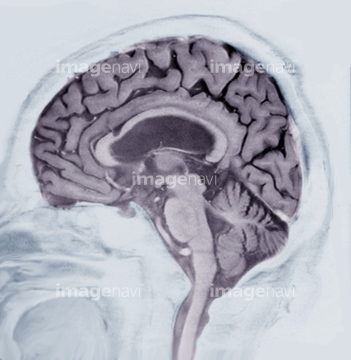
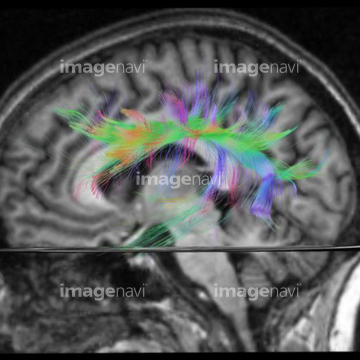
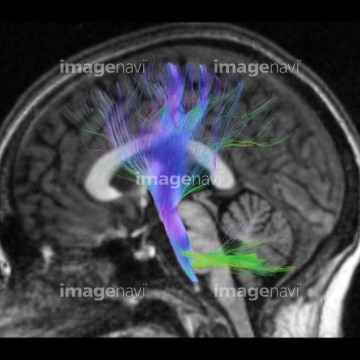
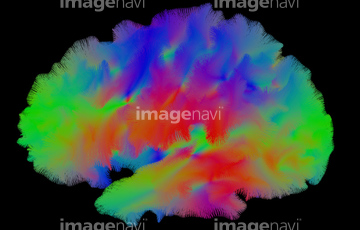
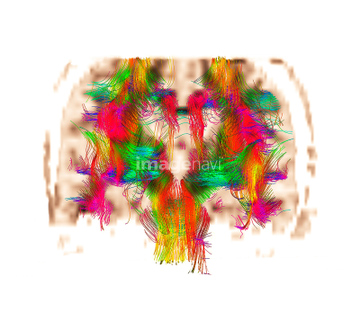
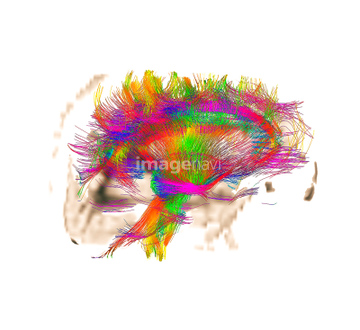
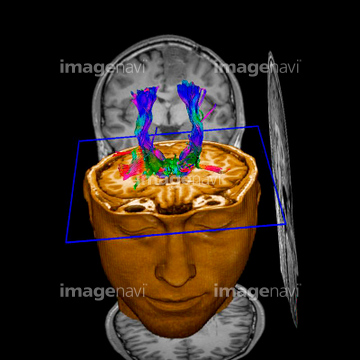
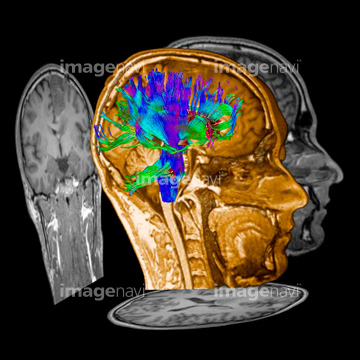
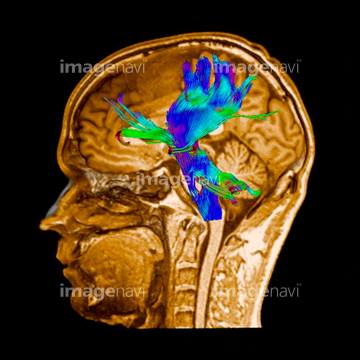
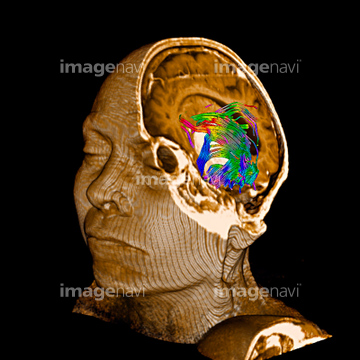
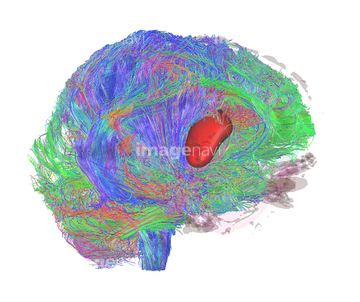
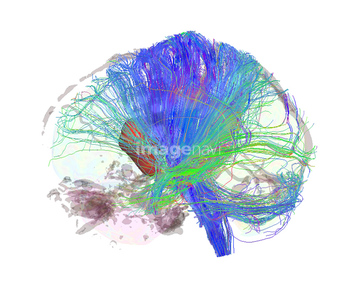
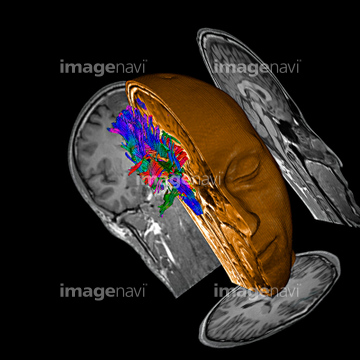
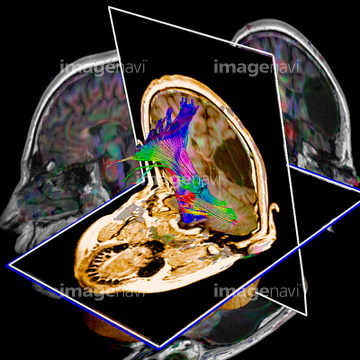
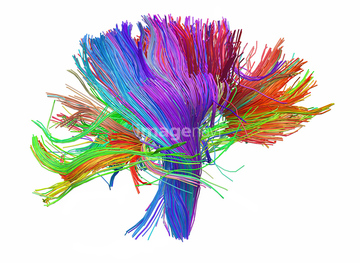
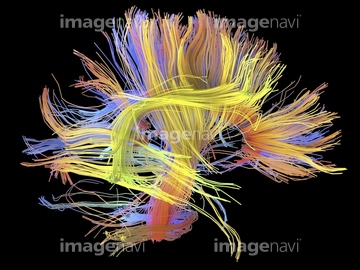
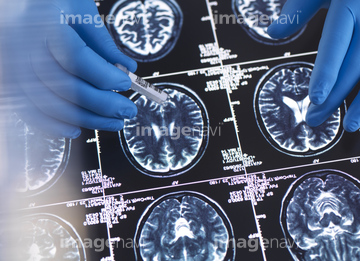
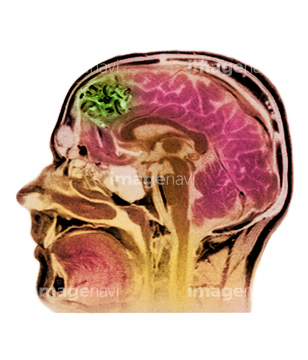
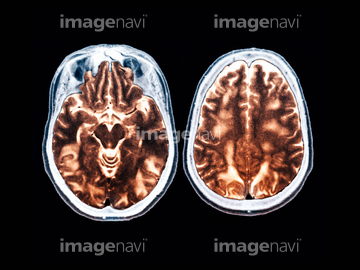
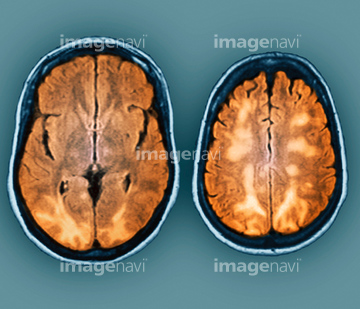
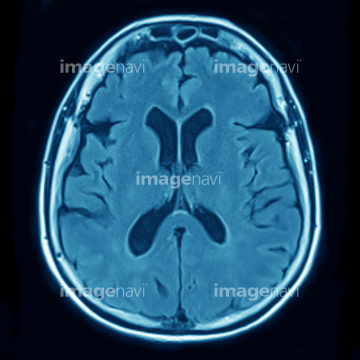
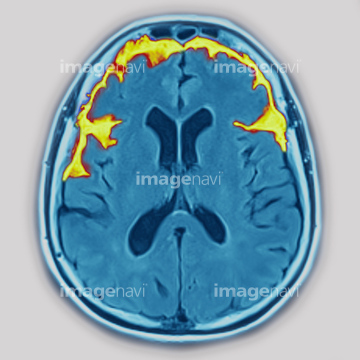
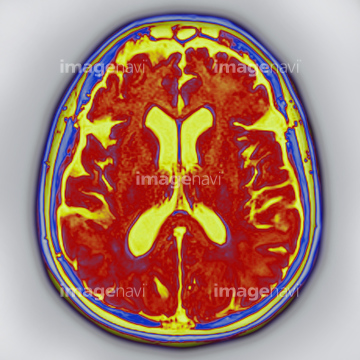
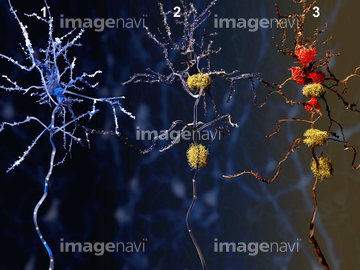
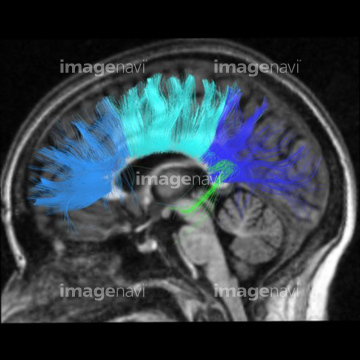
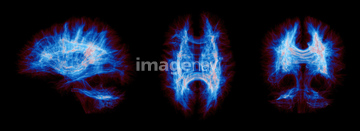
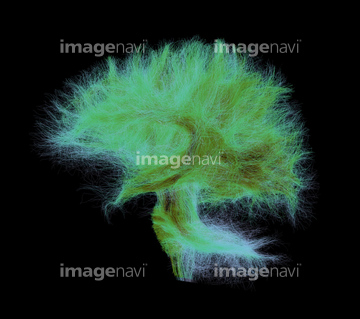
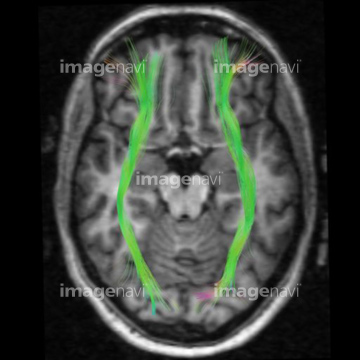
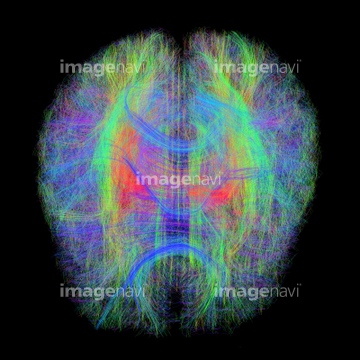
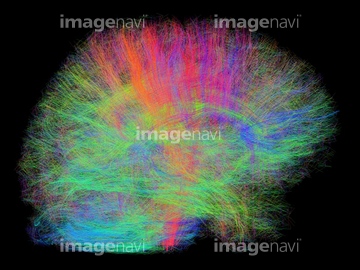
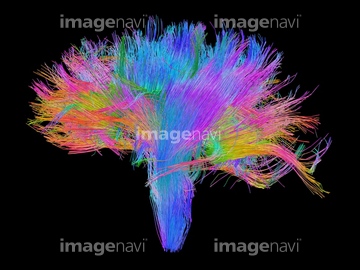
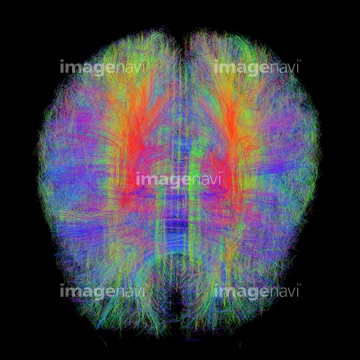
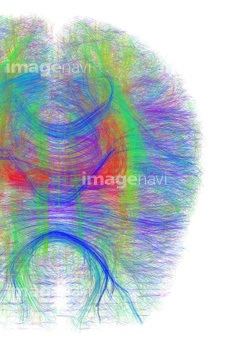
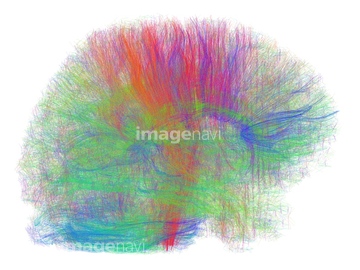
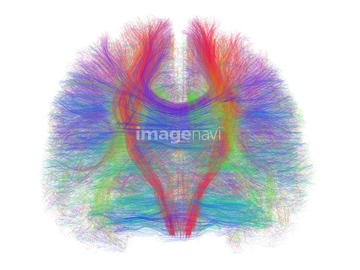
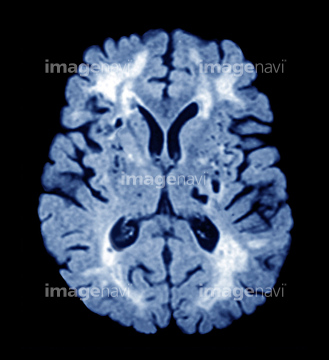
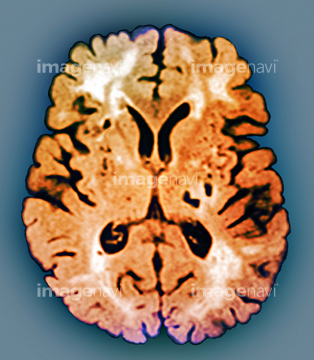
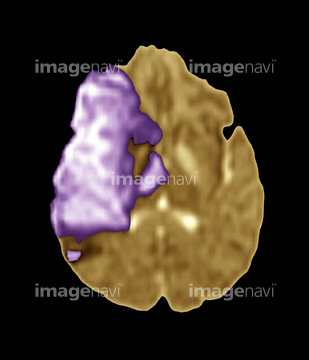
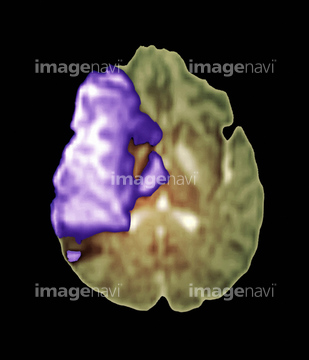
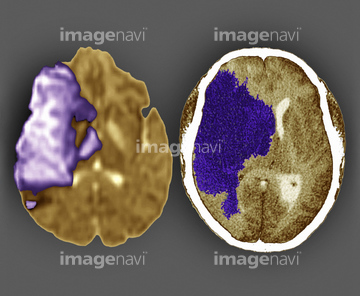
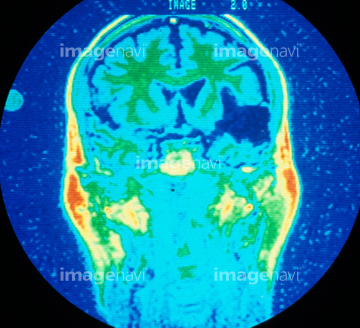
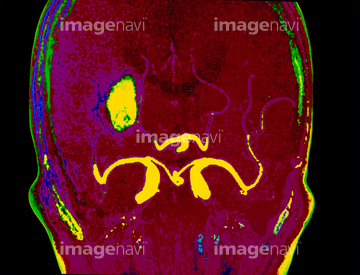
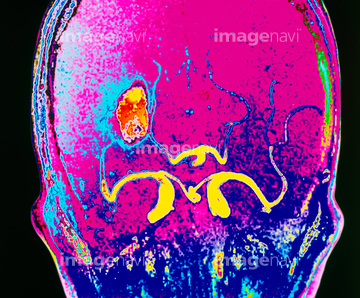
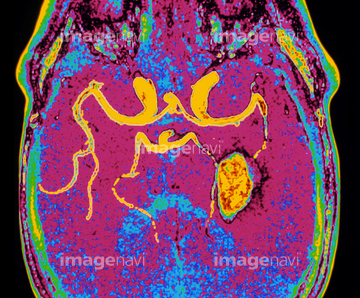
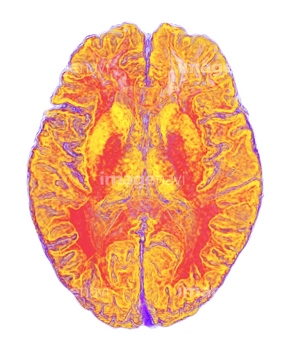
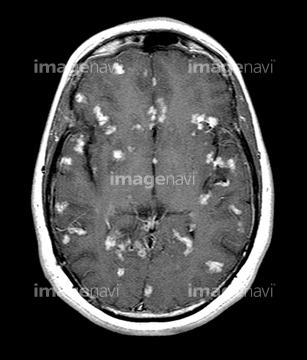
この検索結果には、Brain tumour, DTI and MRI scans、Brain tumour, MRI scan、Multiple sclerosis, MRI scan、White matter fibres of the human brain、Diseased brain、Alzheimer's brainなどが含まれています。
20510184
20510183
20510185
20510186
20510187
20510188
20510189
64042984
20510208
20510209
20510210
20510211
20510212
64062611
64062617
64062624
64072631
64072644
20535994
20535995
20535998
20535999
20510213

20510214
20535984
20535985

20535986
20570190
20570191
64043125
64043128
64043129
64043130
64043131
64071938
64071940
64093542
64163408
64165330
64165331
64165332
64165333
64165334
64165335
64165336
64165337
64165338
64165339
64165340
64165341
64165342
64165343
64165344
21508369
64071941
64071942
64075025
64075026
64075027
64075028
64021754
64078080
64078081
64043109
64043110
64043111
64043112
64043117
64043118
64043119
64043120
64043121
64043139
64263820
17200425
64071925
64071926
64071927
64165365
64263769

20570189
64187413
53156548
53156549
53156556
53156557
53156558
53156559
53156560
53156561

53156562
53156563
17239188
17239189
21508368
21508371
21508375
64043086
64043087
64043088
64043089
64043090
64043097
64043098

64043099
64043100
64043101
64043102
64043103
64043104
64043105
64043106
64043107
64043108
64217040
64066826
64066827
64066833
64066834
64066835
64153283
64010056
| 次ページ |
