HOME > ژتگ^ > ƒrƒWƒlƒX > ƒrƒWƒlƒXƒAƒCƒeƒ€ > ƒ^ƒuƒŒƒbƒgPC
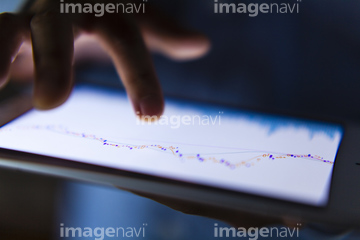
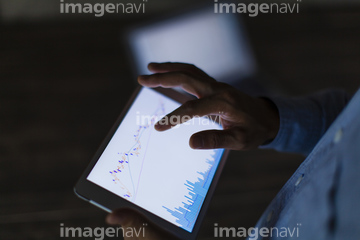
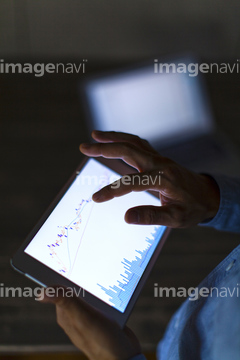
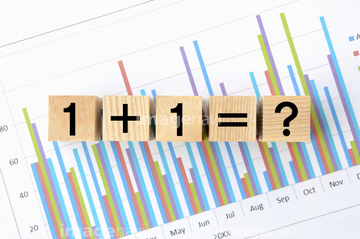
10,000Œڈ‚جژتگ^‘fچق‚ھŒںچُ‚³‚ê‚ـ‚µ‚½پB
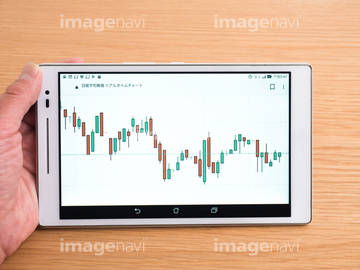
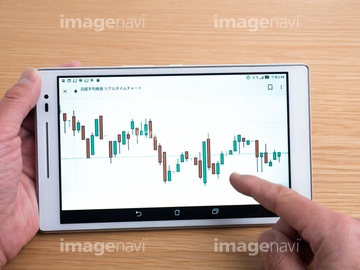
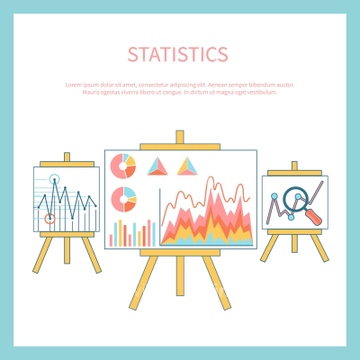
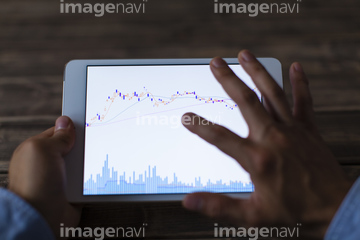
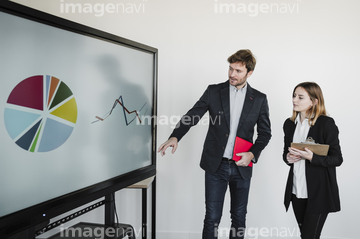
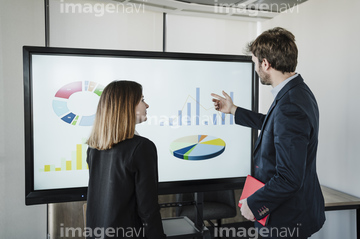
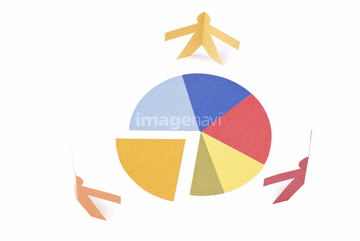
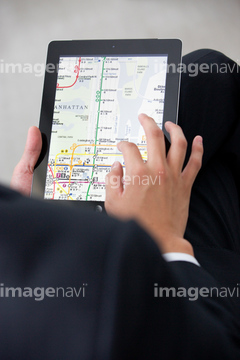
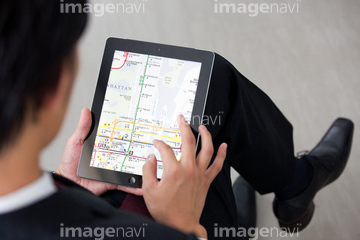
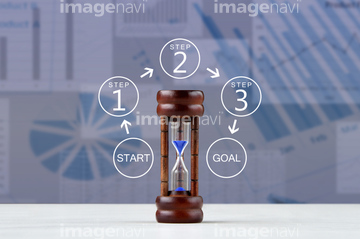
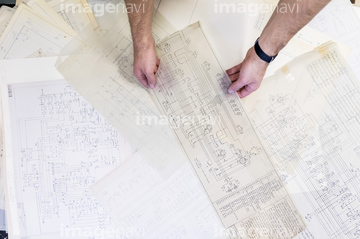
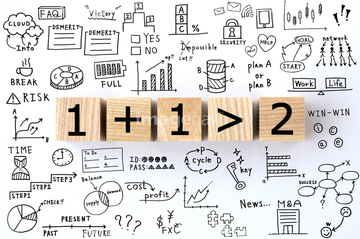
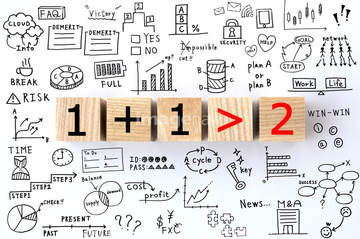
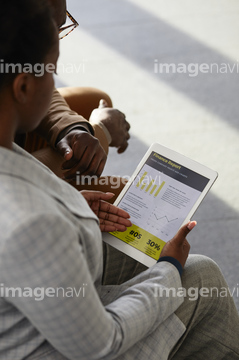
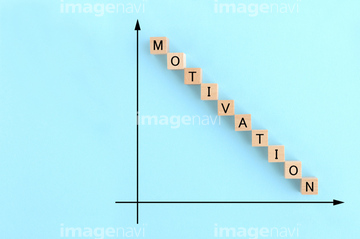
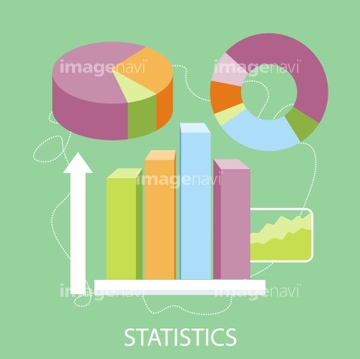
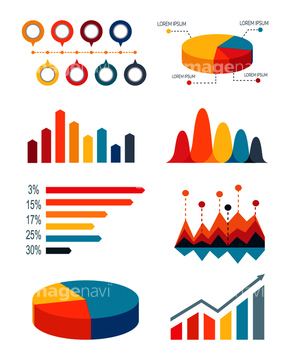
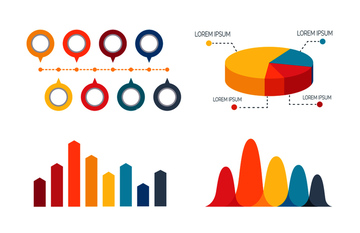
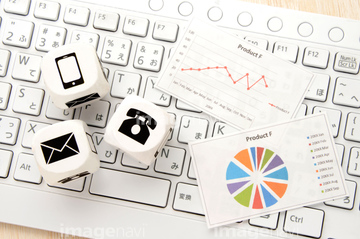
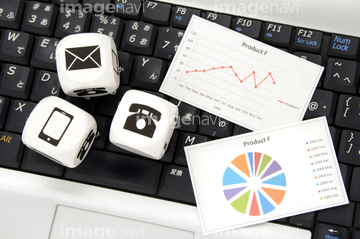
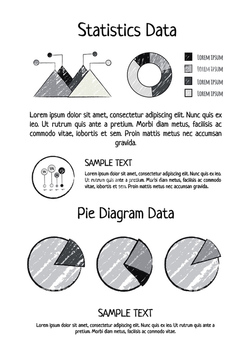
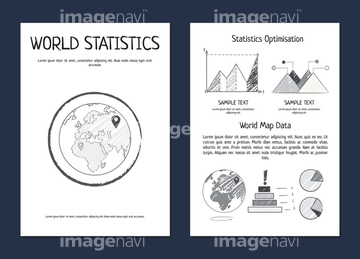
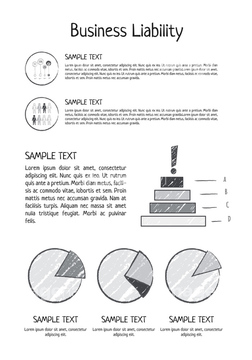
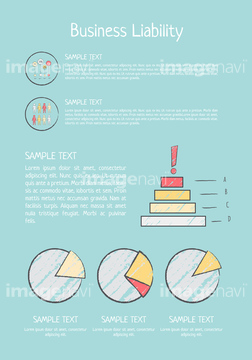
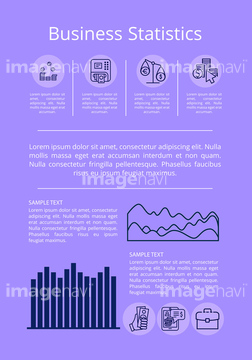
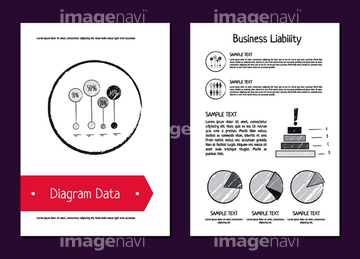
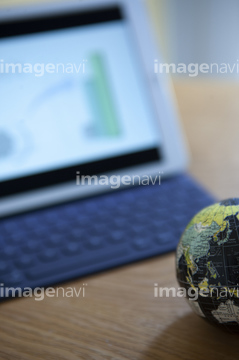
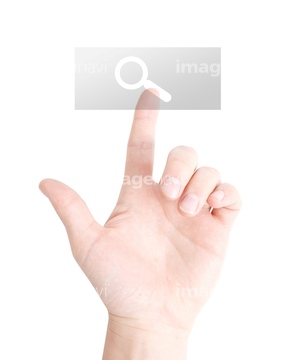
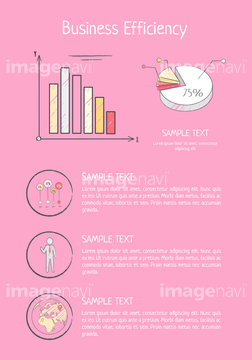
‚±‚جŒںچُŒ‹‰ت‚ة‚حپAƒپƒٹƒbƒg‚ئƒfƒپƒٹƒbƒg‚ج”نٹr‚ًچs‚¤ƒrƒWƒlƒXƒ}ƒ“ƒCƒپپ[ƒWپAٹ”‰؟ڈî•ٌپAƒ^ƒuƒŒƒbƒgPC‚ئƒ`ƒƒپ[ƒg‚ًژ‚ء‚ؤ‚¢‚éˆمژtپALine and bar graphs icons with vertical and horizoپcپAIsometric 3D analysis data. Isometric pie chart flپcپAColleagues discussing paperwork‚ب‚ا‚ھٹـ‚ـ‚ê‚ؤ‚¢‚ـ‚·پB


21572535

21572538


21572521

21572534

21572536

21572520


12429343

12429344


12429292
12429293
12429294
12429295

30909874

21572539

21572531


41201750
41201751


18591898

30909872

21572529


18591621

18591624


30416313


12429341
12429342


31403334


14936064

18106495

18106499

18106500
18106501

21572532

18106504

18106505

18106506

18107470

30909875


31724759

31137801

18585440


14946776

14948756

14948757

14948759

14948760

18585504

30909873

30909877

31601064
31601065
31601066
31601067
31601068

31601069

31135892

17271699

31389290

31392494


14936065


14929970

31426119

31426120

31259373

31259374

31313677

23801018


16965034

32968697


31546044
31546046

31544090

31565879

31565880

31565902

31565903

31148807

31148808

19094480
29040517


31455913
| ژںƒyپ[ƒW |
