HOME > 写真 > 花・植物 > その他植物 > 果物
10,000件の写真素材が検索されました。
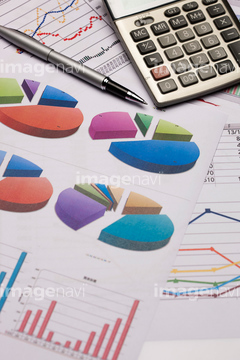
この検索結果には、ビジネスデスクイメージ、The businessman in cost benefit balance concept. B…、Businessman in cost benefit balance concept、The businessman in profit benefit balance concept.…、Man working in office on calculator、見積書とペンなどが含まれています。
23971117
23971115
23971118
23801016
23801017
23801018
23971116
23971119
23079382
30038732

20949443

31544090
30038339
21100109
30038419


19911716
30087391
31544045


29019731
31774614
31496075

30087390
23036525
19429754
18502719


29089720
16936020
30453476


21597389
31134709

31134710
31134711
31134712
31134713
31134714
17278121
14102722
23801026

19988538
19902809
19902810

19902892

32861191


41524479
17269281

19915049
19915050
19915051

32675278
29055025


29056340


30022214
23975909
23975910
31729958
31729959
31729960
31729961
31729962
| 次ページ |
