HOME > 写真 > イラスト・CG > CG > 3DCG
10,000件の写真素材が検索されました。
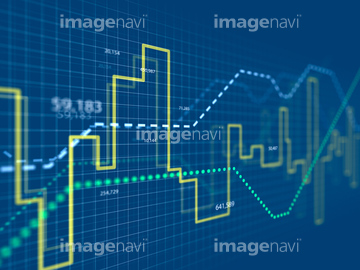
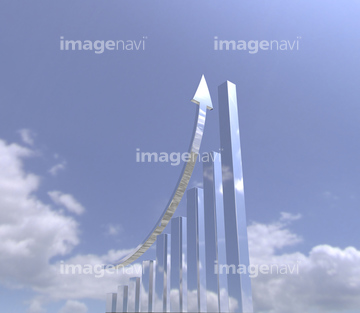
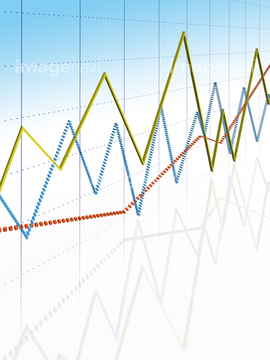
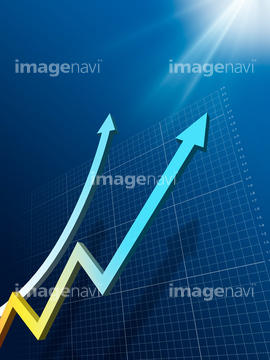
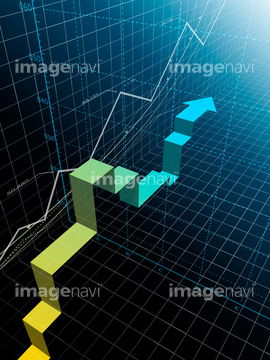
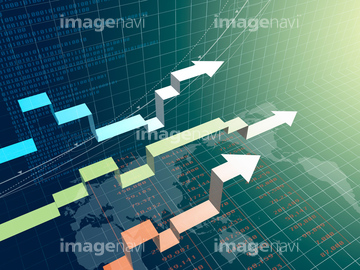
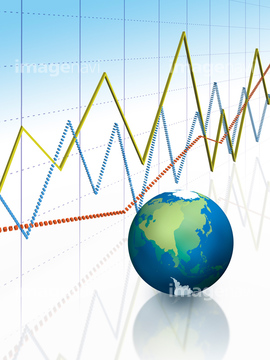
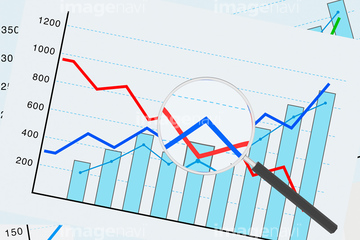
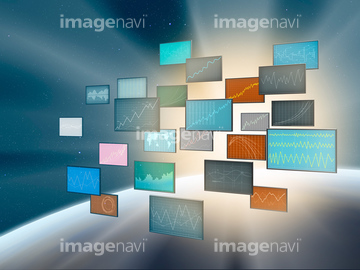
この検索結果には、グラフ、上昇基調の棒グラフ、そそり立つ青い矢印とグラフ表示、グラフと矢印、グラフと株価、青空と上昇基調の棒グラフなどが含まれています。
11855612
11855207
24893959
24893960

11855167
41356957
41356958
41356959
41356960
41356973
41356974
11855206
11855234
11855235

11855171
11855203

11855204

11855197

11855198
11855205

11855168
11855229
11855230
11855608
11854982

11855210
41356986
41356987
41356988
41357006
11855208
11614923

11855212
41323596
41323597
41323598
41323599
41323600
41323601
41356881
41356882
11855173
11855180

11855199
11855200

11855201
11855202
11854985
11854986
11855209
11855231
70281917
41357003
41357004
11855609
11855254
11855255
11855256

11858235
11858240
24884855
11855610
29667518
29667522
29667570
11855189
11855190
29667535
17247694
17262010

11855291

11855213
24682472

11614931
11619933
11619934
11855227
11619932
11855146
11855160
17290471
11855157

41357005
11855166

11855172
11855192
11855281

11614920
11614921
11614922
11855142
11855611

11855599

11855600

11855601
11855606
11855607
11855177
11855178
11855179
20571432
20571481
20571482
20571492
29667525
11855191
11855193
11855194
11855195


11855603
11855196
20520022
11855602
17295101
17262993
17262999
17262016
17262018
17262053
17262204
17265880
17262118
17241207
11858198
17262998

11858408

11858421
41526438
41526439
41323466
64058339
64058340
20525470

11855290
11855292
11620395

11855344
11855604
11620396
| 次ページ |
