HOME > ژتگ^ > ƒCƒ‰ƒXƒgپECG > ƒfƒUƒCƒ“ƒpپ[ƒc > ƒCƒ“ƒtƒHƒOƒ‰ƒtƒBƒbƒN
10,000Œڈ‚جژتگ^‘fچق‚ھŒںچُ‚³‚ê‚ـ‚µ‚½پB
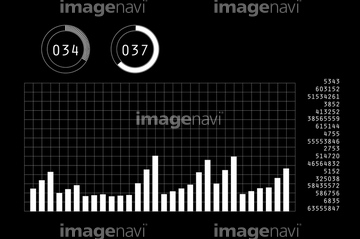
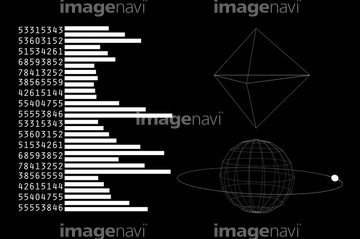
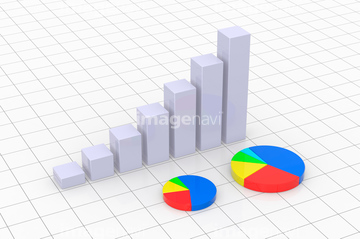
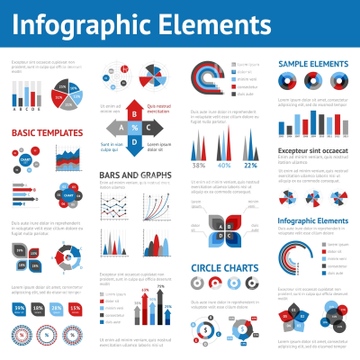
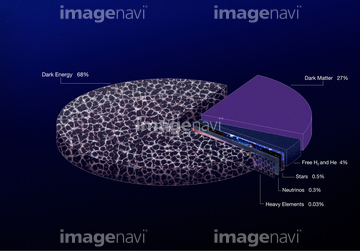
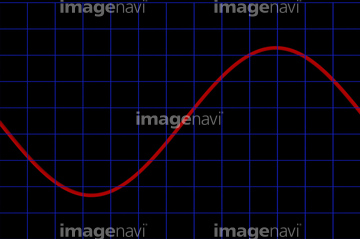
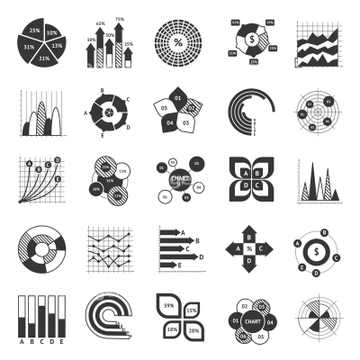
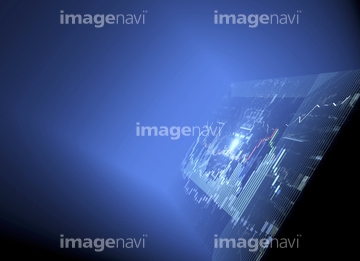
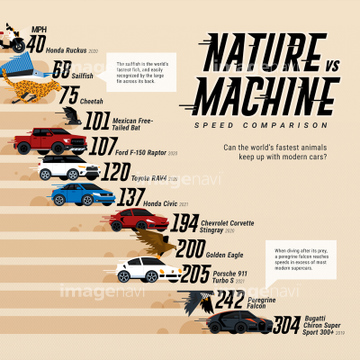
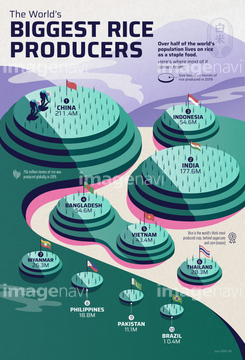
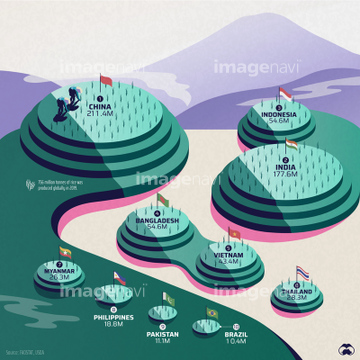
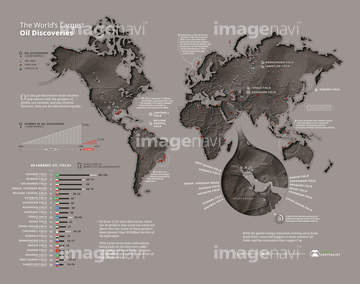
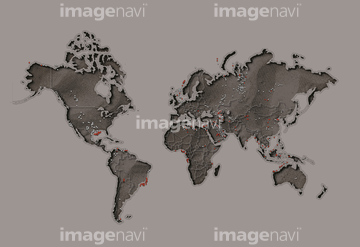
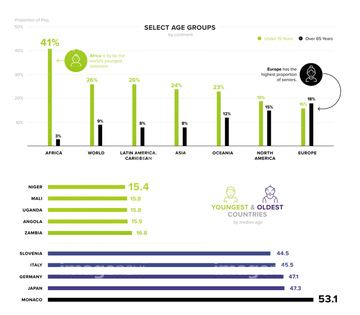
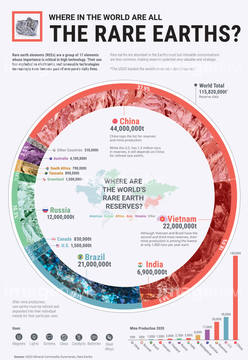
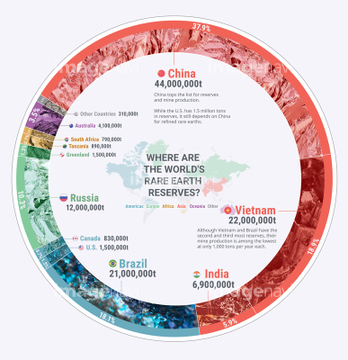
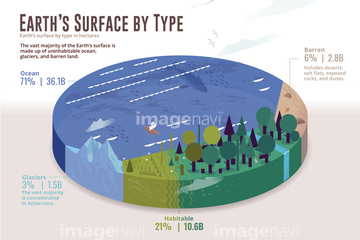
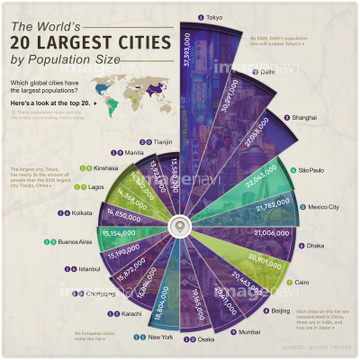
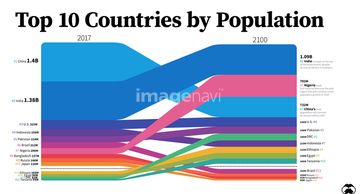
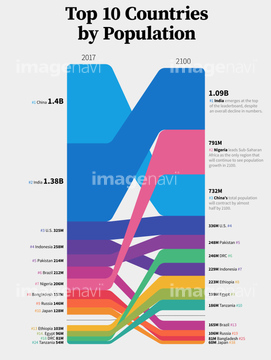
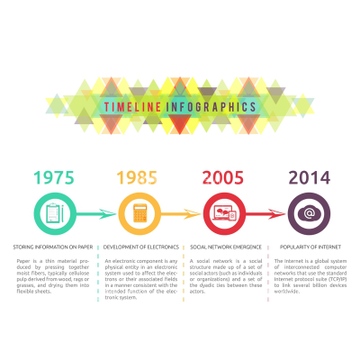
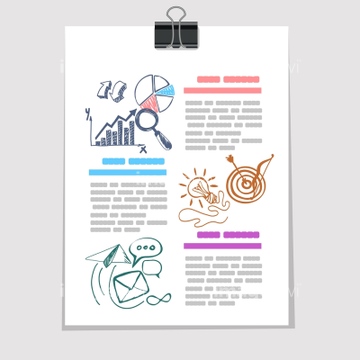
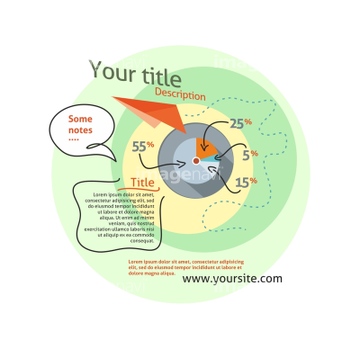
‚±‚جŒںچُŒ‹‰ت‚ة‚حپAƒOƒ‰ƒt‚ئ–îˆَپAƒOƒ‰ƒt‚ئٹ”‰؟پAگآ‹َ‚جƒOƒ‰ƒt‚ئ–îˆَپA–_ƒOƒ‰ƒtپA‰~ƒOƒ‰ƒtپAکZٹpŒ`‚ج—§‘ج‚ئ–ح—lپ@CG‚ب‚ا‚ھٹـ‚ـ‚ê‚ؤ‚¢‚ـ‚·پB


24884855

41356957

41356958

41356959

41356960

41356973

41356974


41356986

41356987

41356988

41357006


41369169
41369171

41356881

41356882

11619932

11619933

11619934

11855610

11855611

20525470


20525471

11614923

16968161

16968164

16968172

11620338

11620339

11620340

11855167


17269272

20561497

20561500

20561501

20561502
20571489
29667570

17269460

41369170

41369104

41369105
41369106
41369107

41369108

41369109

41369110

11855197

11855198

11855205

11855206

11855207

19009546


11855612

11855168

11619935

11614920

11614921

11614922


20571432

20571459

20571481
20571482

20571492


29089260

16968170

16968178


17269454


11620736
17272811
17272817


41369111

41369112

41369113

41369114

41369115

41369116

41369117

41369118

41369119

41369120

41369121

41369122

41369123
41369124

41369125

41369126

41369127

41369128

41369129

41369130

41369131

41369132
41369134

41369135

41369136

41369137

41369138

41369139

41369140

41369141
| ژںƒyپ[ƒW |
