HOME > 写真 > イラスト・CG > CG > 3DCG
10,000件の写真素材が検索されました。
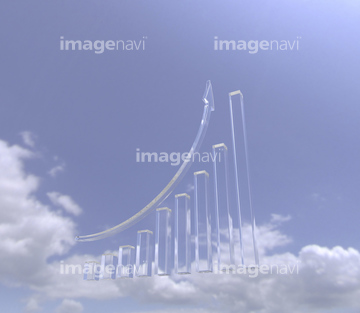
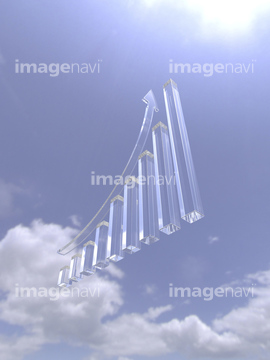
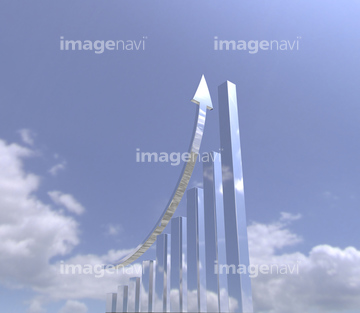
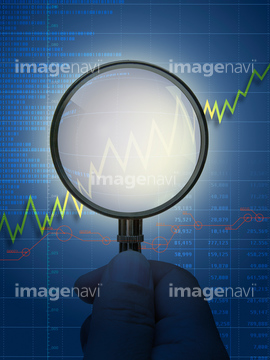
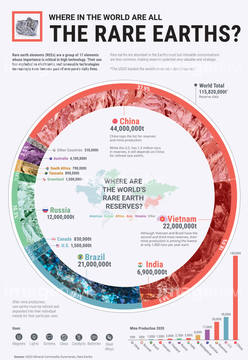
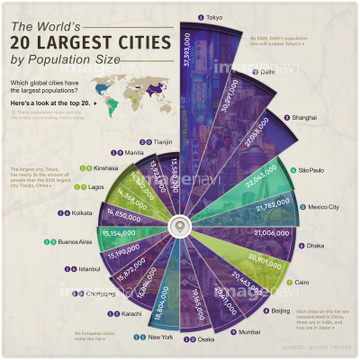
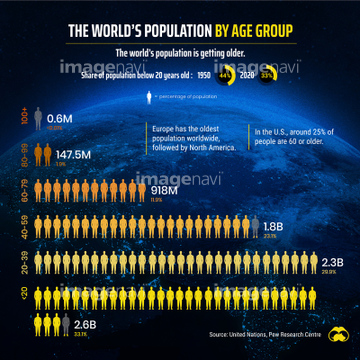
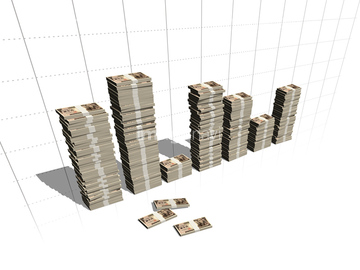
この検索結果には、棒グラフ、グラフと矢印、グラフと株価、青空のグラフと矢印、虫眼鏡でグラフを分析する、虫眼鏡でアジア市場を分析するなどが含まれています。


20525471
41369169
41369171
20525470
41356957
41356958
41356959
41356960
41356973
41356974
41356986
41356987
41356988
41357006
11855150
11855151

17241188

17241189

17241190

20561497
20561500

20561501
20561502


11855153

11855154


11855152
11855233
24884855
11614931
11614932
41356975
41356976
41356977
41356978


29668851
41369170


29089260

24844136
29059206


11855232

16968167
20525472


11855234
11855235
11855192
11855222
41369100
41369101
41369102
41369103
41369104
41369105
41369106
41369107
41369108
41369109

41369110
41369111
41369112
41369113
41369114
41369115
41369116
41369117
41369118
41369119
41369120
41369121

41369122
41369123
41369124
41369125

41369126
41369127
41369128
41369129
41369130
41369131
41369132
41369133
41369134
41369135
41369136
41369137
41369138
41369139
41369140
41369141
41369142
41369143
41369144
41369225
41369226
41369227
41369228
41369229
41369230
11855203
11855204
11855229
11855230
11855208

11855155

11855156
11855189
11855190
11855173
11855180
11855191
11855193
11855194
11855195
11855196
11855175
11855159
11855160

11855209
11855231
11855174
11855176

17236781
64237767
64010416

41280839

41280842
41356881
41356882
29089965

29668689

29668714

29667914
64008376

11619903
| 次ページ |
