HOME > ژتگ^ > ƒrƒWƒlƒX > ƒrƒWƒlƒXƒCƒپپ[ƒW > ‚¨‹àپEƒRƒXƒg
10,000Œڈ‚جژتگ^‘fچق‚ھŒںچُ‚³‚ê‚ـ‚µ‚½پB
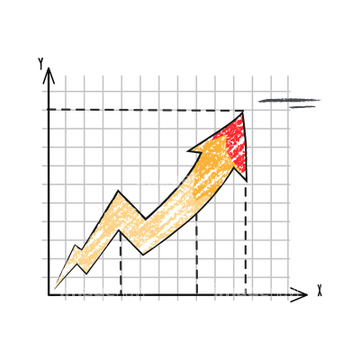
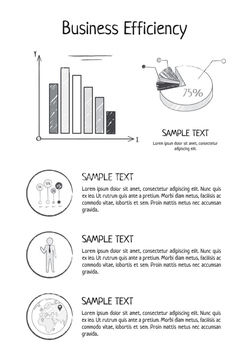
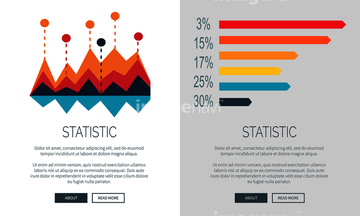
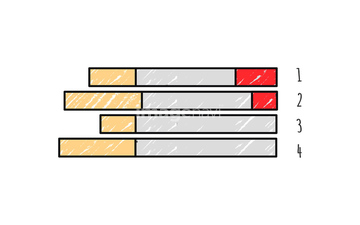
‚±‚جŒںچُŒ‹‰ت‚ة‚حپAƒrƒWƒlƒXƒCƒپپ[ƒWپ\ƒ^ƒuƒŒƒbƒg‚ئƒVƒXƒeƒ€ژè’ پAƒrƒWƒlƒXƒCƒپپ[ƒWپ\ƒpƒ\ƒRƒ“‚جڈم‚ج‰ï‹c—pژ‘—؟ پAƒrƒWƒlƒXƒRƒ“ƒZƒvƒgپAƒrƒWƒlƒXƒ`ƒƒپ[ƒg‚جƒoƒbƒNƒOƒ‰ƒEƒ“ƒhپAƒrƒWƒlƒXƒ`ƒƒپ[ƒg‚ئƒ{پ[ƒ‹ƒyƒ“پAƒrƒWƒlƒXƒ`ƒƒپ[ƒg‚ئƒ{پ[ƒ‹ƒyƒ“‚ئٹل‹¾‚ب‚ا‚ھٹـ‚ـ‚ê‚ؤ‚¢‚ـ‚·پB


29204052


31137426

31137427

31137428

31137429

31137430

31319357

31288553

31288554

31288555


31403981

31403982


19094349


31134826


31124624

31124627

31124637

31124638


31128136

31128137

31128163

31128164

31128165

31128166

31129552

31129556

31129894

31129895

31135066

31135067


31129056

31129057

31129058

31129059

31129060

31129062

31129066

31129067

31129068

31129069

31129100


32861191


31137327


29176127

29176129

29176133

29176138

29176144

29176147

29176150

29176153

29176156

29176163

29176165

29176167

29176170

29176172

29176174

29176177

29176180

29176186

29176189

29176191

29176194

29176197

29176200
| ژںƒyپ[ƒW |
