HOME > 写真 > ビジネス > ビジネスシーン > 商談・プレゼン
10,000件の写真素材が検索されました。
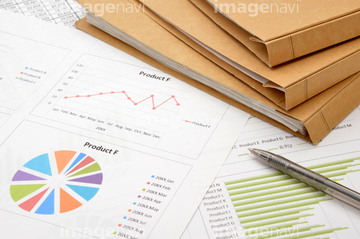
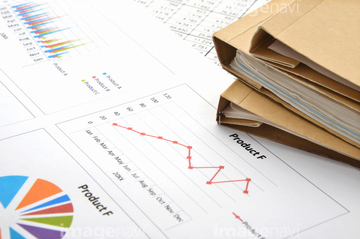
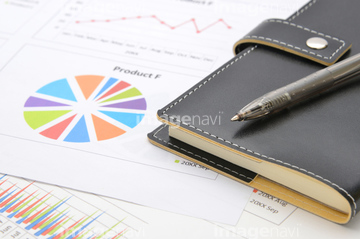
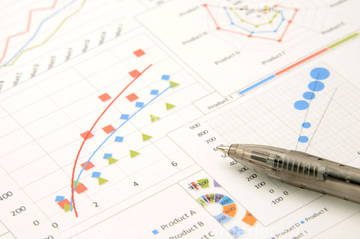
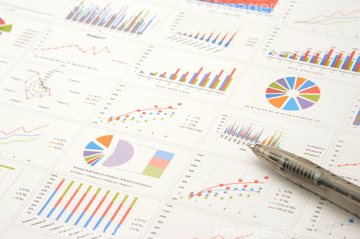
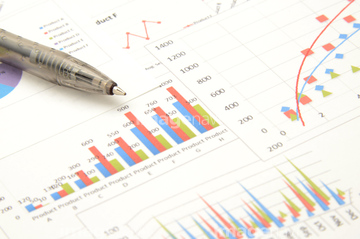
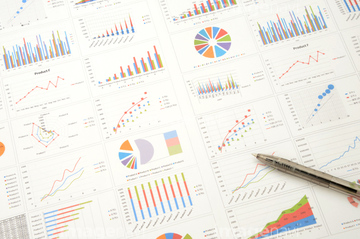
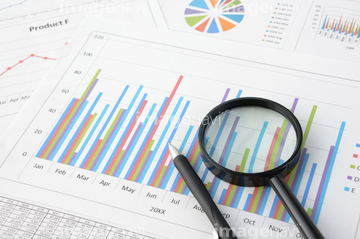
この検索結果には、ビジネスチャートとボールペン、ビジネスチャートとボールペンと眼鏡、ビジネスイメージ―タブレットとシステム手帳 、ビジネスイメージ―パソコンの上の会議用資料 、ビジネスコンセプト、ビジネスチャートのバックグラウンドなどが含まれています。
31319357
31288553
31288554
31288555
31133127
31134575
31137426
31137427
31137428
31137429
31137430

31129552
31129556
31129894
31129895
31135066
31135067
31135885
31137335
31137336
31137337
31137338
31129056
31129057
31129058
31129059
31129060
31129062
31129066
31129067
31129068
31129069
31129100
31124624
31124627
31124637
31124638
31128133
31128134
31128136
31128137
31128163
31128164
31128165
31128166
31137327
31124636


29620274
29621200
29610762
29611648
29612212
29612293
29612436
29614317
29614582
29615313
29615704
29619284
29619798
29619903
29704134
29039910
31667922

31381374
31403323
31403324
31403980
31403981
31403982
31426115

31426116
31426117
31335341
31335342
31313676
31323346
31323347
31279306
31279307
31253070
31253071
31259372
31259375
31135069
31128333
31128334
31128335
31775455
31131515

31135068
31129065
31129101
| 次ページ |
