HOME > 写真 > ビジネス > ビジネスシーン > 商談・プレゼン
10,000件の写真素材が検索されました。
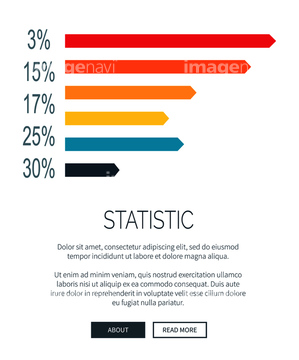
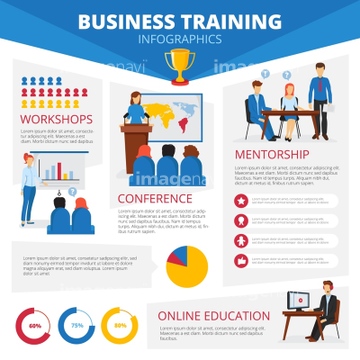
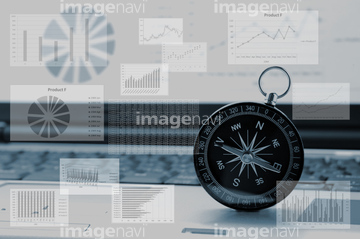
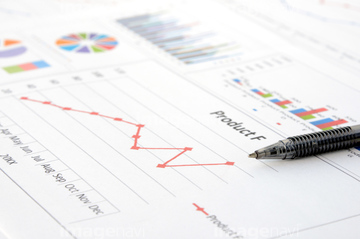
この検索結果には、ビジネスの展望イメージ―方位磁針とビジネスチャート、ビジネスイメージ―ビジネス資料 、ビジネスチャートとボールペン、Infographic chart divided on several parts showing…、Infographic showing ratio and proportion of consti…、Startup offer visualization on black and white pos…などが含まれています。
31753083

31135067
31288554
29176127
29176129
29176133
29176138
29176144
29176147
29176150
29176153
29176156
29176163
29176165
29176167
29176170
29176172
29176174
29176177
29176180
29176186
29176262
29176267
29176271
29176277
29176279
29176289
29176291
29176293
29176296
31133127
31726556
31786306
31124624
31124637
31128136
31128163
31128164
29176284

20558545

31288553
31137426
31137427
31137428
31137429
31137430
31137327
31403323
31403324
31403980
31310382

31133128

16966997
16962952
16962956
16962963
16962966
31552743

31552744

31552745
31552746
20558969
29204052

29176189
29176191
29176194
29176197
29176200
29176205
29176209
29176217
29176221
29176224
29176228
29176230
| 次ページ |
