HOME > 写真 > 人物 > 感情 > 恐れ
10,000件の写真素材が検索されました。
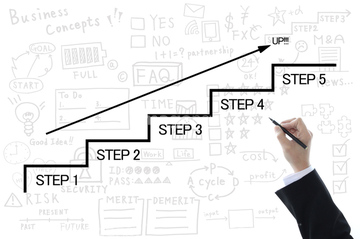
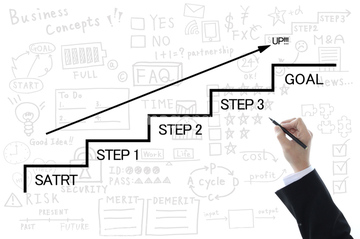
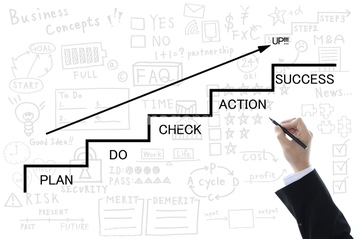
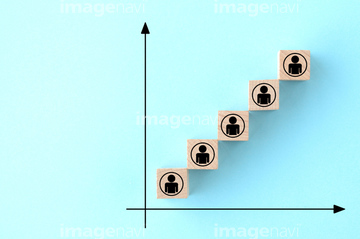
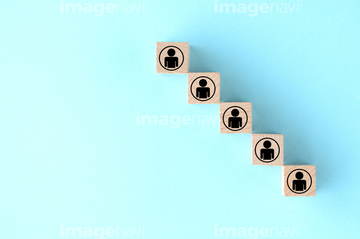
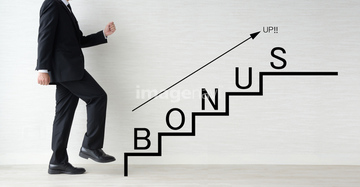
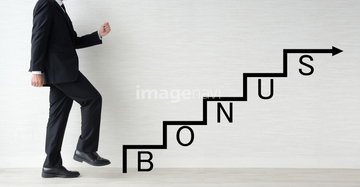
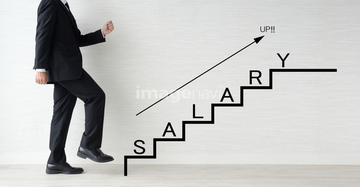
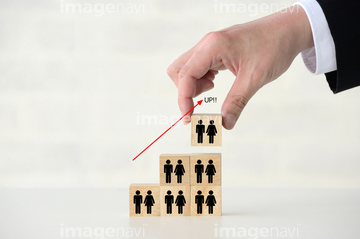
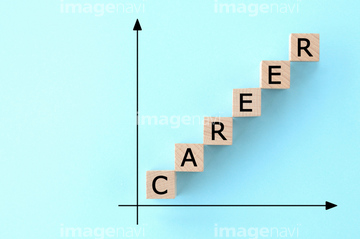
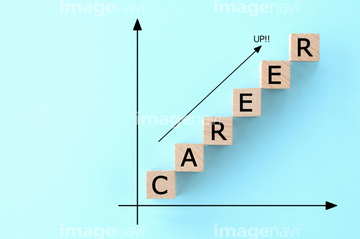
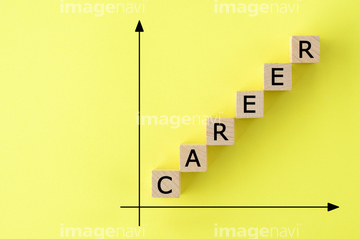
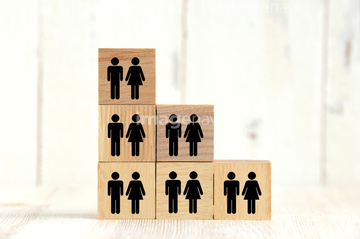
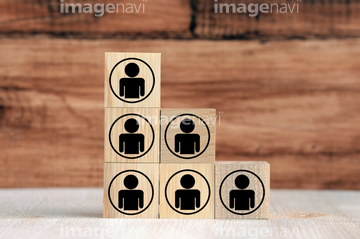
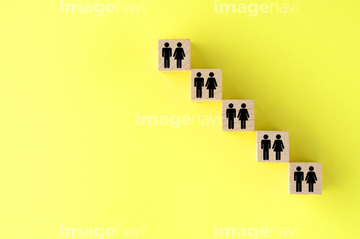
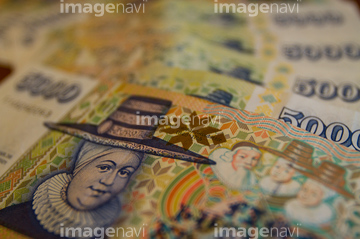
この検索結果には、人口の減少イメージ、ビジネスイメージ―ステップアップ、人の増加イメージ、ビジネスイメージ―成功のために、投資のリスク、キャリアアップイメージなどが含まれています。

30438213
30443907

31559585
31559586
31559587

17278119
31389287
31389288

31389289

31389294

31389295

31389296
31392491
31392492
31392493
31505239
31505240
31514301
31514302
31246161
32674952
31559580
31559581
31559582
31559583
31559589
31559590
31559591
30447498


30453737

41086817

41086819
30453517
31559584

30450639


31565879

31565880

31565902

31565903
31574208

31574209
31574210
31574217
31574218

31574219
31574220
31574221
31574222

31660105

31660106

31660110

31660111
31552743

31552744

31552745
31552746

31550513

31550514
31559598

31559599

31559600

31559601
31559602
31559603

31539524

31539525
31539526
31539527

31539528

31539529
31539530
31539531
31511118
31511119
31505204
31505205
31505208
31505209
31505213
31505214
31505215
31505216
31505221

31505222

31505223
31505224
31514269
31514270
31514273

31514274
31514278

31514279
31514280

31514281
31514286

31514287
31514288
31514289
31514309
31514310
30447499

30450368
30450369
30436365

21597389
23073214


30060261

16962938

16962966

16962952
30459197
30022188
31603442

31603443
31603444
31603445

31603446
31603447


30447645
30453516
23092479

30443350
31559576
31559577
31559578

31559579
31559588
30450581
30459105

31550499
31550500

31550501
31550502


29089720


30459858


16946637

41338300
41338301
41338303
30385938
16923271
| 次ページ |
