HOME > 写真 > イラスト・CG > CG > 合成写真
10,000件の写真素材が検索されました。
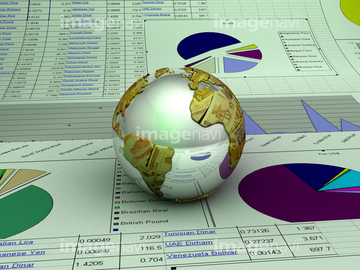
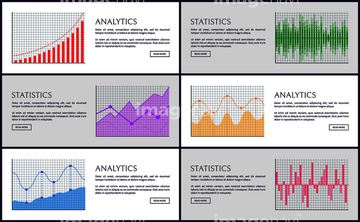
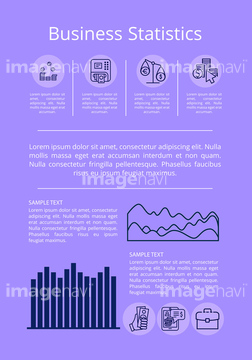
この検索結果には、ビジネスイメージ―スケジュール管理 、株価、売り上げのグラフ、ビジネスイメージ―分析、dynamic abstract image of arrows and graph lines o…、Illustrative image of dollar sign with graph sign…などが含まれています。
30452316
30453517
30022309
16936044
16936023
30453516
30028219
16936047
16966997
16967011
16967019
16962935
16962938
16962952
16962956
16962957
16962958
16962959
16962963
16962966
16962968
16962969
10918132
31131516
40009566
40009567
40009568
40009569
40009570
41546444

31426115
31426116
31426117
16946660
19912514
19912515
52203119
52203120
52203121
19252971
19252972
19252973
16962960
16962961
16962964
31288555
10918470
10918332
10918334
23952307
40846403
40846404
40846405
40846406
40846407
40846408
10975944
31133127
31135066

31135067

31135885

29204052
16958697
16936036
41086817
41086819
31546033
31128330
31131517
16936042
40842408
16936035
40870882
31129100
41201750
41201751
24665474

24665475
24665476

24665478
31426118
31426119
31426120
31131485
31131518
31133128
31134008
31128333
31128334
31128335
31120685
41268895
41268896
41268897
41268898
41268899
16946645
16946646
16946648
30038725
31129065
31128331
31128332
31131515
41086816
30928340
30928341
30928342
40503400
40503401
40009560
40009561
40009562
40009563
40009564
40009565
40846414
40846443
40846458

31632055
31633426
35659543
41249589
41249590

24880658
10918323
30038732
16946637
31136422
31136423
16936039

31135089
16962943
31129555
16936046
41546443
41546445
41546446
| 次ページ |
