HOME > ژتگ^ > ƒrƒWƒlƒX > ƒrƒWƒlƒXƒCƒپپ[ƒW > ‚¨‹àپEƒRƒXƒg
10,000Œڈ‚جژتگ^‘fچق‚ھŒںچُ‚³‚ê‚ـ‚µ‚½پB
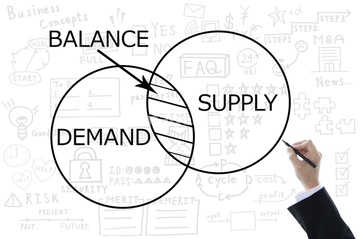
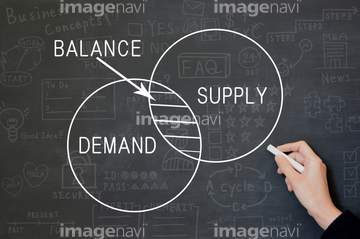
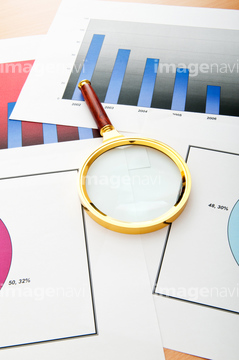
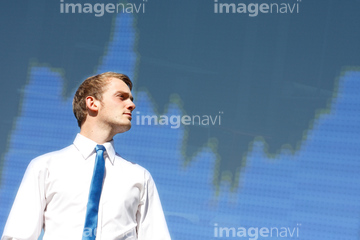
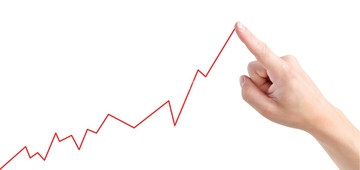
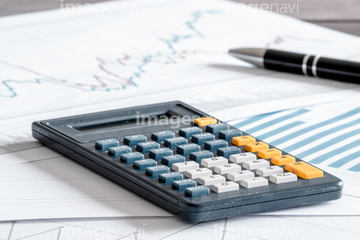
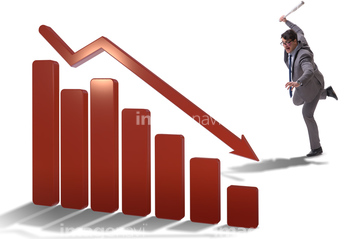
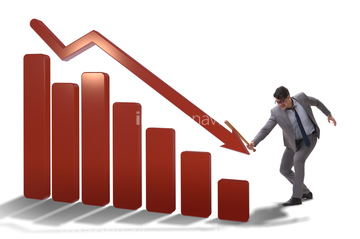
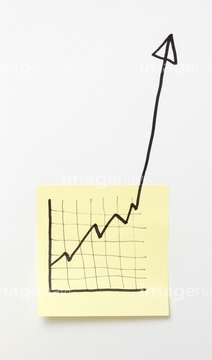
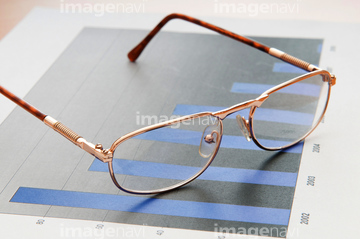
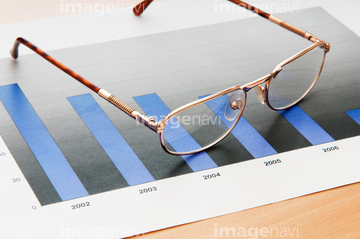
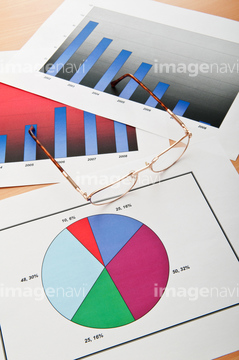
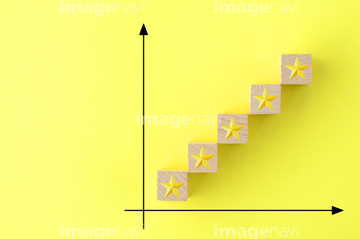
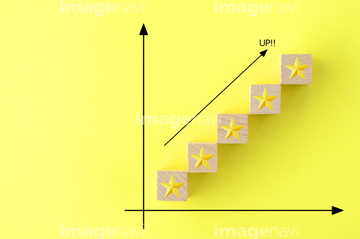
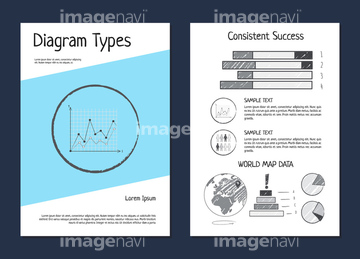
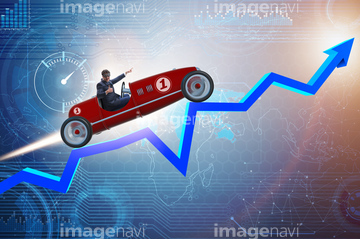
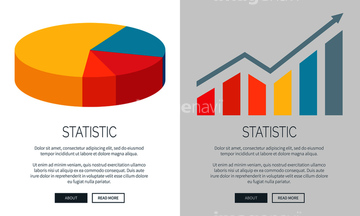
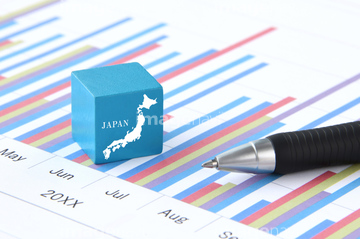
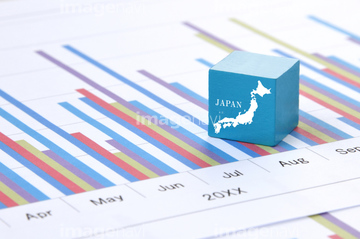
‚±‚جŒںچُŒ‹‰ت‚ة‚حپAژù—v‚ئ‹ں‹‹‚جƒoƒ‰ƒ“ƒXپAƒrƒWƒlƒXƒCƒپپ[ƒWپ\ژù—v‚ئ‹ں‹‹پAƒrƒWƒlƒXƒCƒپپ[ƒWپ\•ھگحپAGrowing bar charts in economic recovery concept - پcپAƒrƒWƒlƒXƒ`ƒƒپ[ƒg‚ئƒ{پ[ƒ‹ƒyƒ“پAƒrƒWƒlƒXƒCƒپپ[ƒWپ\ƒrƒWƒlƒXژ‘—؟ ‚ب‚ا‚ھٹـ‚ـ‚ê‚ؤ‚¢‚ـ‚·پB

31392309

31385576

31385577

31390557
31392486
31388731

31486457

29176127

29176129

29176133

29176138

29176144

29176147

29176150

29176153

29176156

29176163

29176165

29176167

29176170

29176172

29176174

29176177

29176180

29176186

29176262

29176267

29176271

29176277

29176279
29176289

29176291

29176293

29176296

31335341

31335342

19092444
19092901

29039355

29039357

29039372

29039389
29039390

29204052


31288554

31135067
31124624

31124637

31128136

31128163

31128164


31403332
29038806


19094349
29039910

29176189

29176191

29176194

29176197

29176200

29176205
29176209
29176217

29176221

29176224

29176228

29176230

29176232

29176235

29176238

29176241
29176242

29176243

29176245

29176248

29176251

29176253

29176259

29176284


29204363

29204364

29204365

29204366

31601058

31601059

31601060
31601061

31601062

31601063
31505204
31505205
31514269
31514270

31775455

31775497

35808868

35640658


35799568

35799569

| ژںƒyپ[ƒW |
