HOME > ژتگ^ > ƒrƒWƒlƒX > ƒrƒWƒlƒXƒCƒپپ[ƒW > ‚¨‹àپEƒRƒXƒg
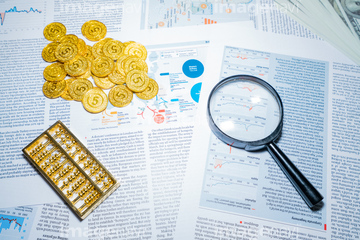
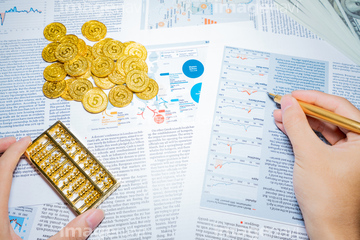
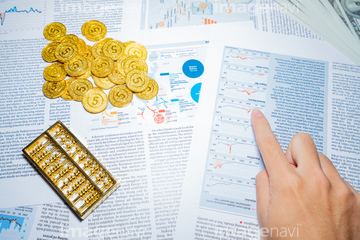
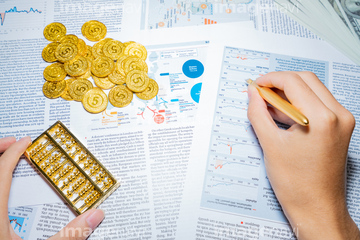
10,000Œڈ‚جژتگ^‘fچق‚ھŒںچُ‚³‚ê‚ـ‚µ‚½پB
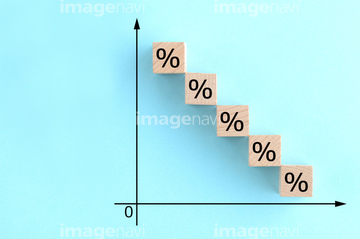
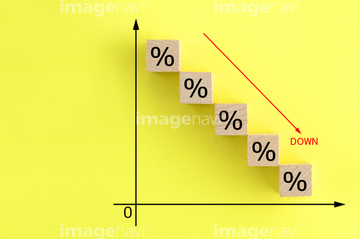
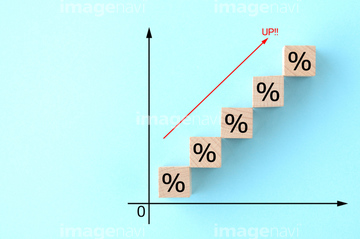
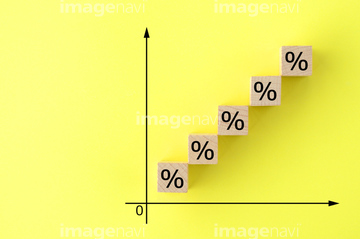
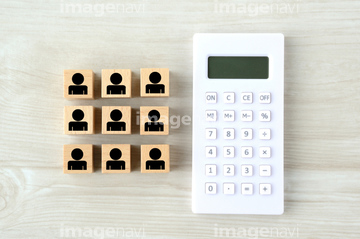
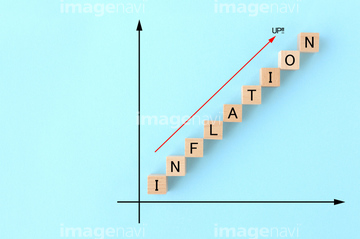
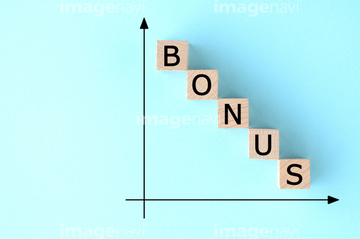
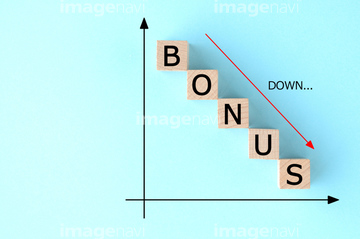
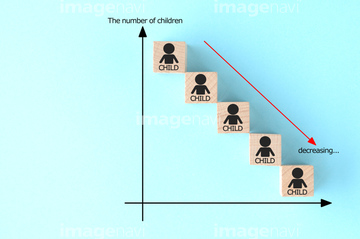
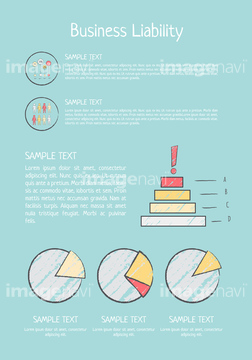
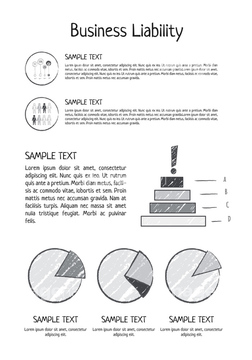
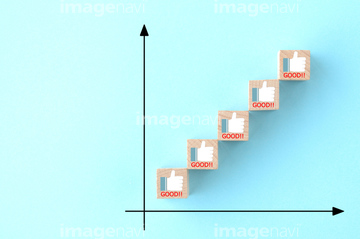
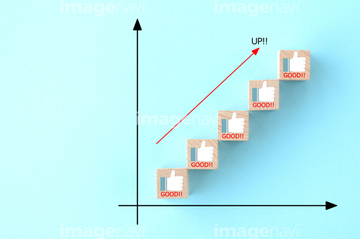
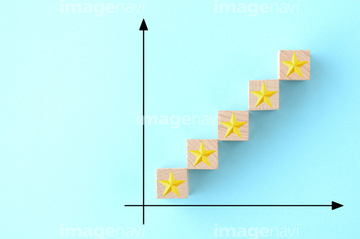
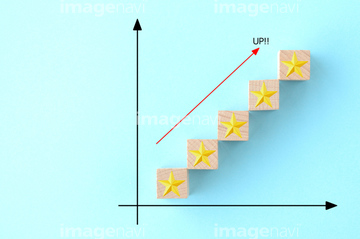
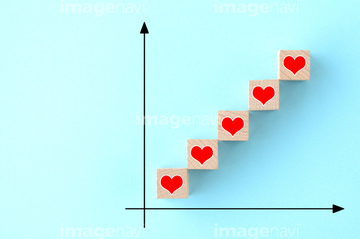
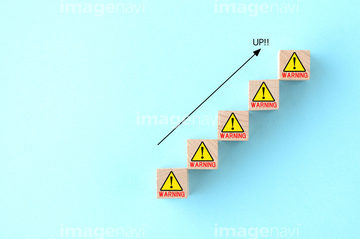
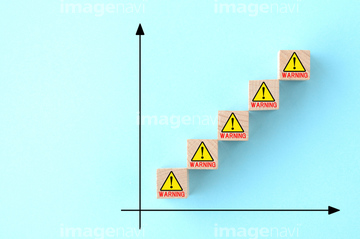
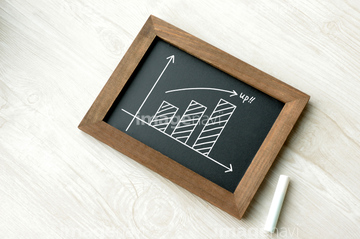
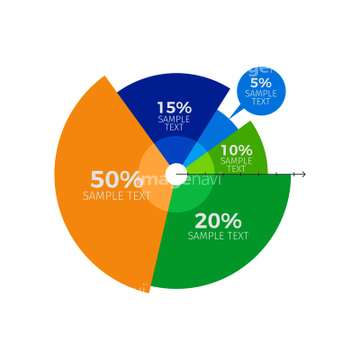
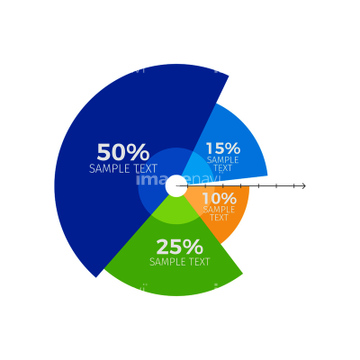
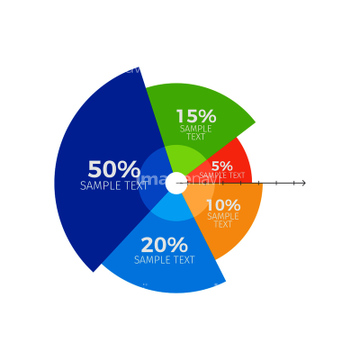
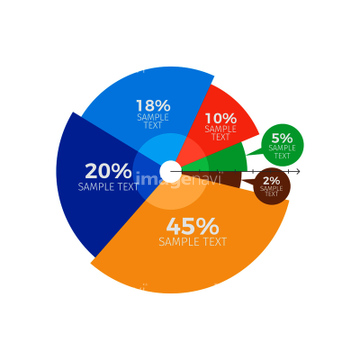
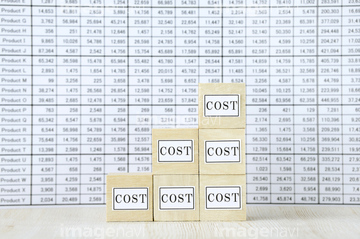
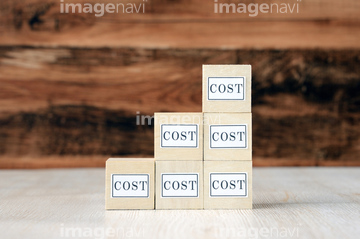
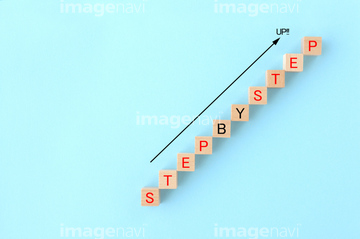
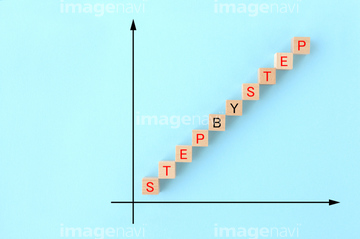
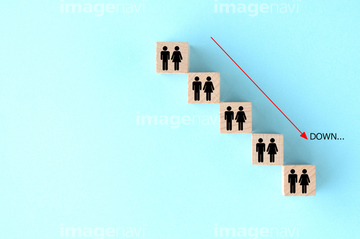
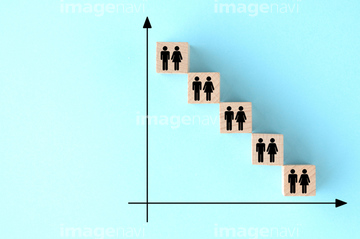
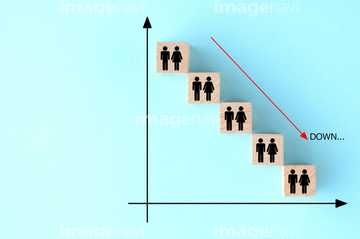
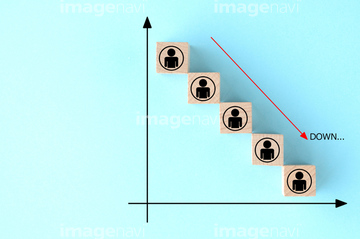
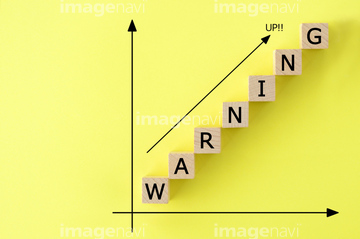
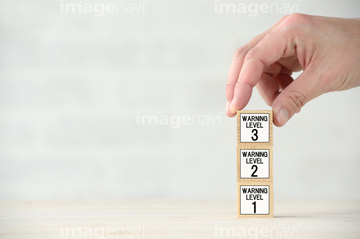
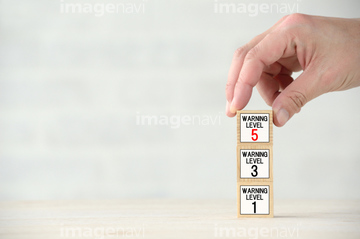
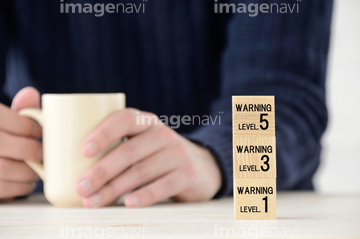
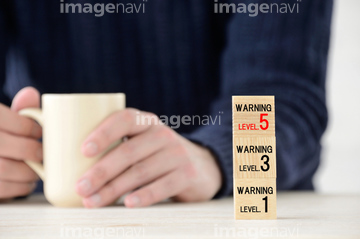
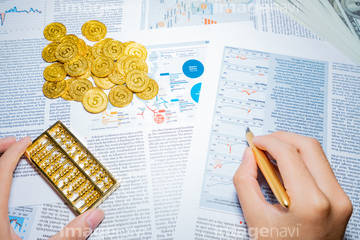
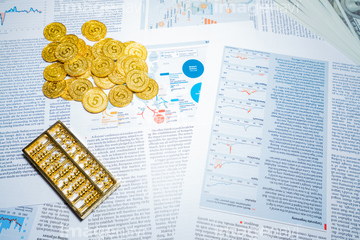
‚±‚جŒںچُŒ‹‰ت‚ة‚حپAŒ¸ڈ‚·‚éƒpپ[ƒZƒ“ƒeپ[ƒW‚جƒOƒ‰ƒtپAڈمڈ¸‚·‚éƒpپ[ƒZƒ“ƒeپ[ƒW‚جƒOƒ‰ƒtپAƒrƒWƒlƒXƒCƒپپ[ƒWپ\ŒvژZپAƒrƒWƒlƒXƒRƒ“ƒZƒvƒgپ\‹¦—ح‚ئ–³Œہ‚ج‰آ”\گ«ƒCƒپپ[ƒWپAƒRƒXƒg‚ئ—ک‰vپAچ•”آ‚ة•`‚©‚ꂽƒOƒ‰ƒtپ\‰؛چ~‚ب‚ا‚ھٹـ‚ـ‚ê‚ؤ‚¢‚ـ‚·پB

31729960
31729961

31729964
31729965

31729958
31729959

31729962
31729963

31403332


31724826

31403340

31718801

31718802

31718804

31724824


31773305

31773306

31585068
31585069
31585070
31585071

31287667
31773303

35805985
35805986

31559584

31603442

31603443

31603444
31603445

31603446
31603447


35764982
35764983

31724825

35615171

31505211

31505212
31511118
31511119
31505204
31505205
31505208
31505209


31586857
31586858
31586859

31586860

31586861

31586862

31586863
31586864

31586865
31586866
31586867

31586868

31505213

31505214

31505215

31505216

31718799
31718800

31718803

31765413

31765414


31287669

31586881

31586882

31586883

31586884

31586885
31586886

31591093

31591094

31591095

31591096

31591097

31591098

31591099

31591100

31591101

31591102

31287665
31287666
31773304


31701766
31701767
31701768
31701769

31559585

31559586
31559587

31585072

31585073

31585074
31585075
31585501
31585502

31585503

31585504
31585505
31585506
31585507

31585508

31585509

31585510
31585511
31585512


35766197

35766198

31601079

31601080

40870590

40870591

40870592

40870593

40870594

40870595

40870596

40870597

40870600

40870601

40870602

40870603


31559576

31559577

31559578

31559579
31559580
31559581
31559582
31559583


40787057

40787058


35624597

35624598

31577838

31774615

31774616

31774617

31774618
| ژںƒyپ[ƒW |
