HOME > ژتگ^ > ƒ‰ƒCƒtƒXƒ^ƒCƒ‹ > ‚¨ڈj‚¢ژ–پE’¢ژ– > ڈAگEپEڈAگEٹˆ“®
10,000Œڈ‚جژتگ^‘fچق‚ھŒںچُ‚³‚ê‚ـ‚µ‚½پB
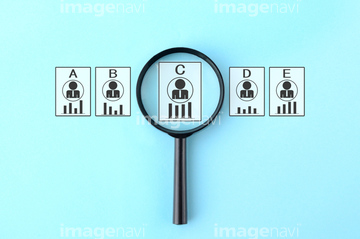
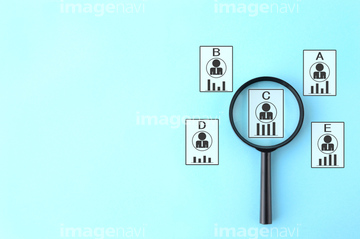
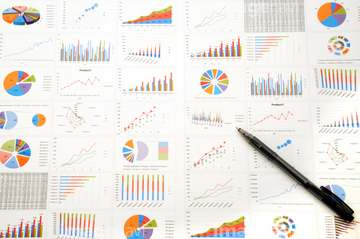
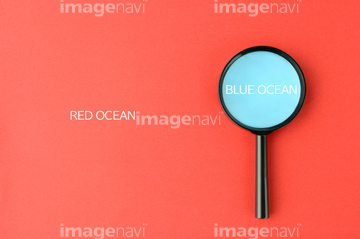
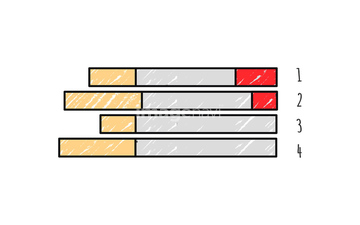
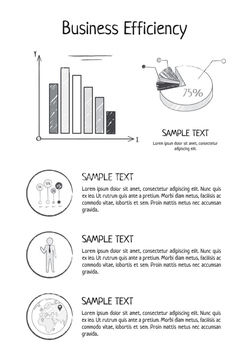
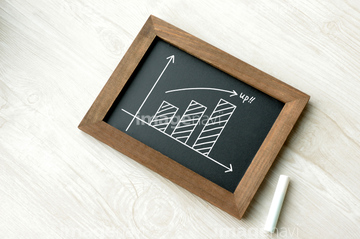
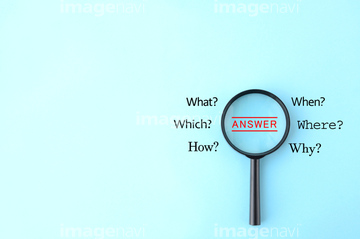
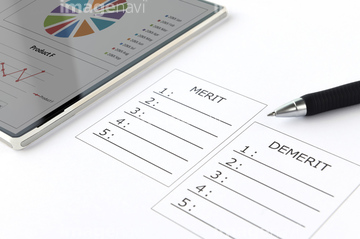
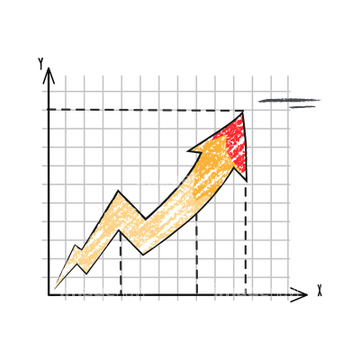
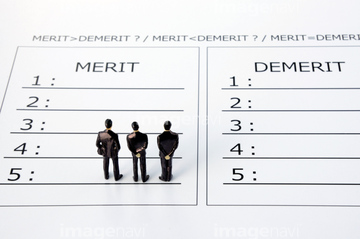
‚±‚جŒںچُŒ‹‰ت‚ة‚حپAƒrƒWƒlƒXƒCƒپپ[ƒWپ\•ھگحپE’ژٹل‹¾‚ئƒOƒ‰ƒtپA’ژٹل‹¾‚إƒOƒ‰ƒt‚ًٹدژ@‚·‚éƒrƒWƒlƒXƒ}ƒ“‚جژ茳پA’ژٹل‹¾‚ئ—lپX‚بƒOƒ‰ƒtپ\•ھگحƒCƒپپ[ƒWپAƒrƒWƒlƒXƒCƒپپ[ƒWپ\ƒrƒWƒlƒXژ‘—؟ پAƒrƒWƒlƒXƒCƒپپ[ƒWپ\ƒOƒ‰ƒtپEƒ`ƒƒپ[ƒg‚جژ‘—؟پA‰EŒ¨ڈم‚ھ‚è‚جƒOƒ‰ƒt‚ئƒrƒWƒlƒXƒ}ƒ“‚جژ茳‚ب‚ا‚ھٹـ‚ـ‚ê‚ؤ‚¢‚ـ‚·پB


35624597

35624598

31135067


35757913

35757914

31403323

31403324

31137429


31135069

31135066

35636680
35636681
35792144

31403326

31137616

31137617

31137618

31726556

35799568

35799569

31335341

31335342

31403980


31137426

31137427

31137428
31137430

31765423


31539540

31539541

31539542

31539543

31319357


31137725

31539544

31539545

31539546

31539547

31288554

31124624

31124637

31128136

31128163

31128164
31726557

35606235

29204052

35715867

31323346

31323347

31403981

31403982


31313676


35805977

31765415


31660107

31772316


31135068

35636682

35792145

31287668

31403329

31120698

31288553

31124627


31552743

31552744

31552745
31552746

35616331

35616332


31711312


31718799
31718800

31718801

31718802

31718803

31718804

31765413

31765414

29038806

31667922

35798053


16967011

16962968


29176127

29176129

29176133

29176138

29176144

29176147

29176150

29176153

29176156

29176163

29176165

29176167

29176170

29176172

29176174

29176177

29176180

29176186

29176262

29176267

29176271

29176277

29176279

29176289

29176291

29176293

29176296

16962958

31772318
31772319

31406904

31406905

31406906

31406907


20558545

20558969


31403327

31403328

31137346

29176284


31129058

31129059

31129060

31129062

40787057

40787058


31381374

31253070
| ژںƒyپ[ƒW |
