HOME > ژتگ^ > ƒrƒWƒlƒX > ƒrƒWƒlƒXƒAƒCƒeƒ€ > ڈ‘—ق
10,000Œڈ‚جژتگ^‘fچق‚ھŒںچُ‚³‚ê‚ـ‚µ‚½پB
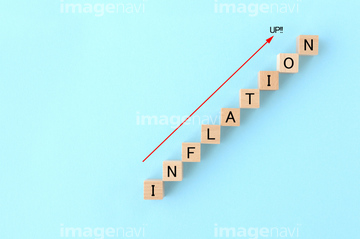
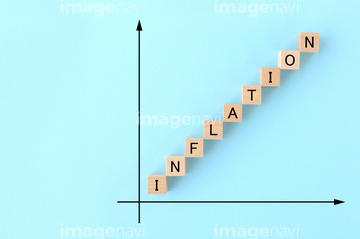
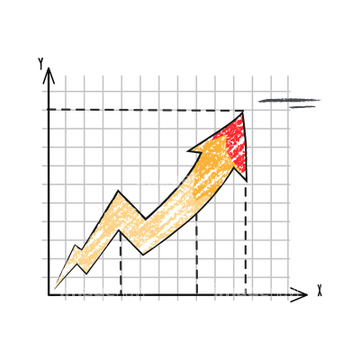
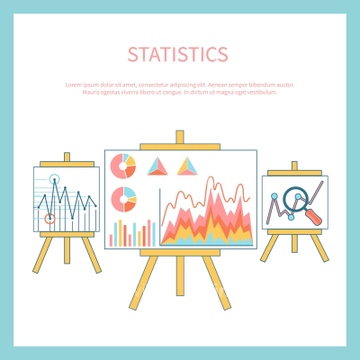
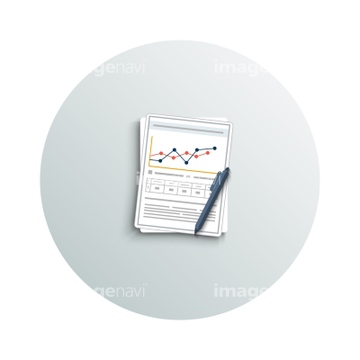
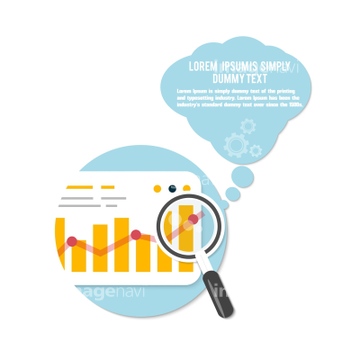
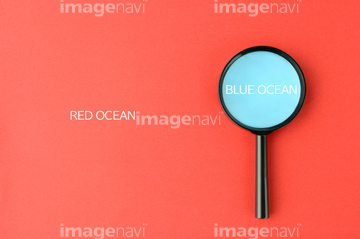
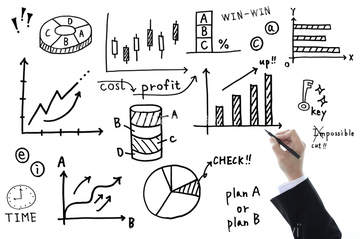
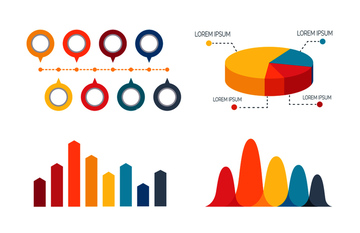
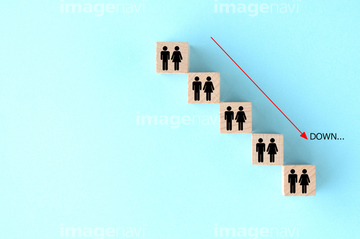
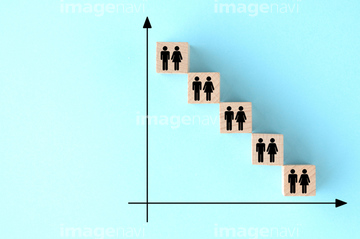
‚±‚جŒںچُŒ‹‰ت‚ة‚حپA’ژٹل‹¾‚ئ—lپX‚بƒOƒ‰ƒtپ\•ھگحƒCƒپپ[ƒWپAƒrƒWƒlƒXƒCƒپپ[ƒWپ\•ھگحپE’ژٹل‹¾‚ئƒOƒ‰ƒtپA’ژٹل‹¾‚إƒOƒ‰ƒt‚ً•ھگح‚·‚éƒrƒWƒlƒXƒ}ƒ“‚جژ茳پA’ژٹل‹¾‚إƒOƒ‰ƒt‚ًٹدژ@‚·‚éƒrƒWƒlƒXƒ}ƒ“‚جژ茳پAƒrƒWƒlƒXƒCƒپپ[ƒWپ\ƒOƒ‰ƒtپEƒ`ƒƒپ[ƒg‚جژ‘—؟پA‰EŒ¨ڈم‚ھ‚è‚جƒOƒ‰ƒt‚ئƒrƒWƒlƒXƒ}ƒ“‚جژ茳‚ب‚ا‚ھٹـ‚ـ‚ê‚ؤ‚¢‚ـ‚·پB
35624598

35624597


35757913

35757914


31135067

31726556


35799568

35799569

35606235

35805977
31726557

31120698


31403323

31403324

31765415

31539540

31539541

31539542

31539543

31137429

31403980

31135069

31287667

35798053

35715867


31718799
31718800
31718801

31718802


31660107

31539544

31539545

31539546

31539547

31135066

31552743

31552744

31552745
31552746
35619687
35619688

35805985

35805986

31403340

31134709

31134710

31134711

31134712

31134713

31134714

29204052


35799570

31718803

31718804

31765413

31765414


29089720

20558545

20558969


31765423

31335341

31335342

31137346


40787057

40787058

31406904

31406905

31124624

31128163

31128164


31403326

31137616

31137617

31137618
30013091
31344119

31344120


31660112

31319357

31135068


31772316


35616331

35616332


31711312

31701766
31701767
31701768
31701769

35619689
35619690

35636680
35636681
35792144

41546443

41546444

41546445

41546446

31137426

31137427

31137428
31137430

01006855


31783507


31169732

31406906

31406907

16967011

16962948

16962951

16962968
| ژںƒyپ[ƒW |
