HOME > ژتگ^ > ƒrƒWƒlƒX > ƒrƒWƒlƒXƒpپ[ƒ\ƒ“ > گV“üژذˆُ
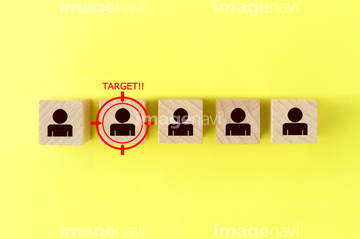
10,000Œڈ‚جژتگ^‘fچق‚ھŒںچُ‚³‚ê‚ـ‚µ‚½پB
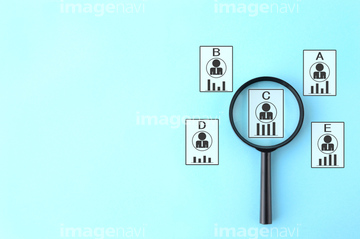
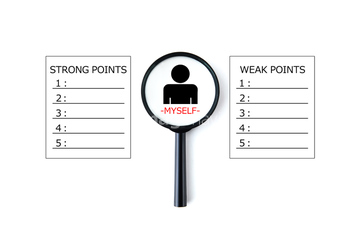
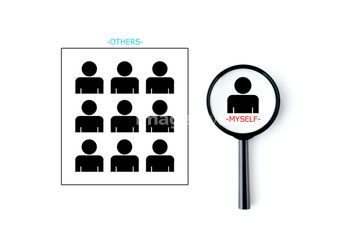
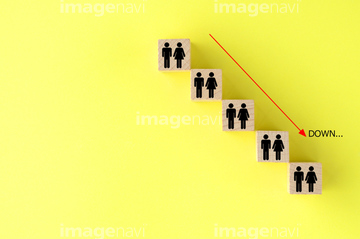
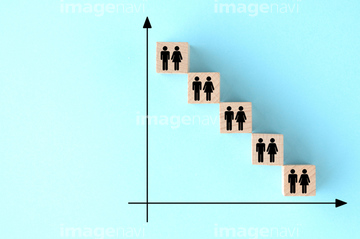
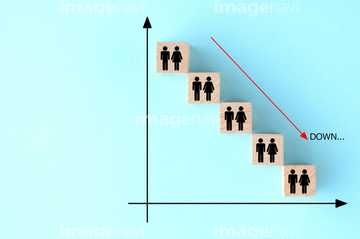
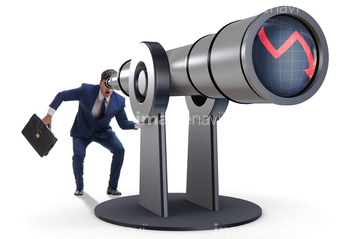
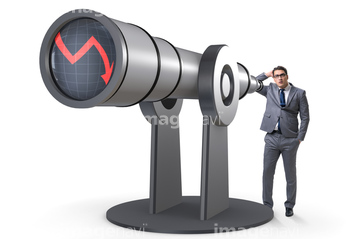
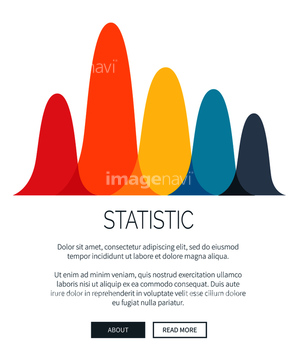
‚±‚جŒںچُŒ‹‰ت‚ة‚حپAƒrƒWƒlƒXƒCƒپپ[ƒWپ\—DڈG‚بگlچق‚ج”Œ©پAƒrƒWƒlƒXƒCƒپپ[ƒWپ\گlژ–پE•]‰؟پA’ژٹل‹¾‚إƒOƒ‰ƒt‚ًٹدژ@‚·‚éƒrƒWƒlƒXƒ}ƒ“‚جژ茳پA’ژٹل‹¾‚إƒOƒ‰ƒt‚ً•ھگح‚·‚éƒrƒWƒlƒXƒ}ƒ“‚جژ茳پAƒrƒWƒlƒXƒCƒپپ[ƒWپ\گlژ–‚ئ•]‰؟پAƒrƒWƒlƒXƒCƒپپ[ƒWپ\گlژ–‚ب‚ا‚ھٹـ‚ـ‚ê‚ؤ‚¢‚ـ‚·پB

35636682

35792145

35636680

35636681
35792144

31394343

31394344

31394345

31394346

31526936

31526937

31526938


31348793

31348794

31348795

31311069

31311070

31311073

31311074

31311075

31315537


31311066

31311067

31311068

31790693

35805977

31775455

35799570


31760112

31760113

31760114

31760115

31559592

31559593

31559594

31559595

31559596

31559597

31559598

31559599

31559600

31559601

31559602

31559603


31572007

31572010

31760110

31760111

31550513

31550514

31550515

31550516

31550517

31550518

31550519

31550520
35764979

31559588
31559589
31559590

31559591

31701770

31701771

31701772
31701773

31315533

31315534

31315535

31315536

35620766

35620767

35620768

35766861

35766862

35766863

31775456

31775457


31685966

31685967

31685968

31685969

35799568

35799569


31660110

31660111

31660112


31550495

31550496

31550497

31550498

31550499

31550500

31550501

31550502

31572008

31572009

31572011

31572012

31572013

31689315

31689316

31689317

31689318

31689319

31403329


35757913

35757914

31559570

31559571

31559572

31559576

31559577

31559578

31559579
31559580
31559581
31559582
31559583

31559584

31559585

31559586
31559587

31570923

31570924

31570968

31570969

31701766

31701767
31701768
31701769


31775453
31775454

35624597

35624598


35636678


| ژںƒyپ[ƒW |
