HOME > ژتگ^ > ƒ‰ƒCƒtƒXƒ^ƒCƒ‹ > ‚¨ڈj‚¢ژ–پE’¢ژ– > ڈAگEپEڈAگEٹˆ“®
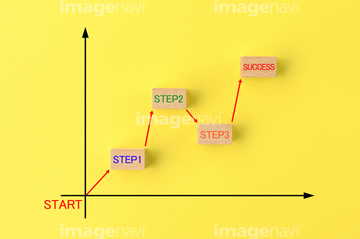
10,000Œڈ‚جژتگ^‘fچق‚ھŒںچُ‚³‚ê‚ـ‚µ‚½پB
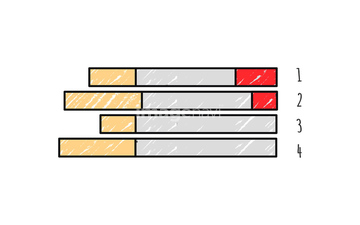
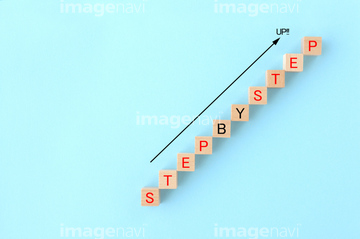
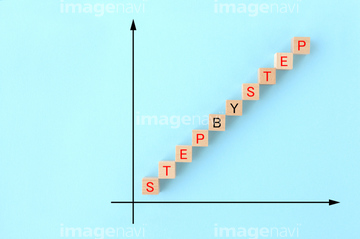
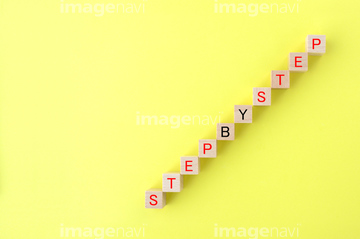
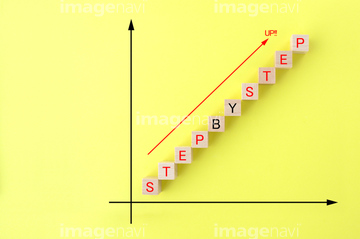
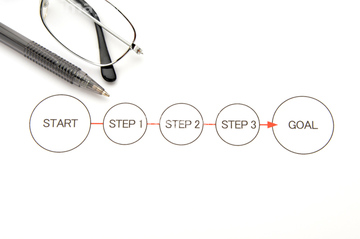
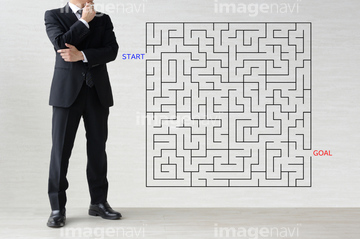
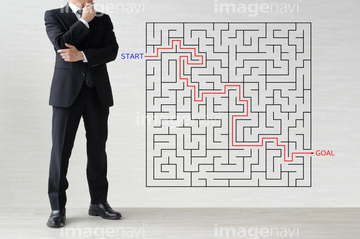
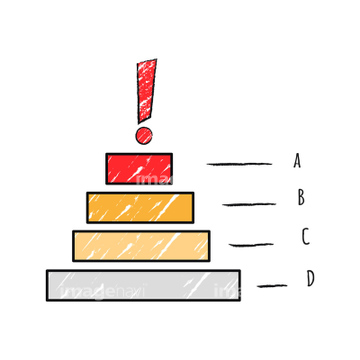
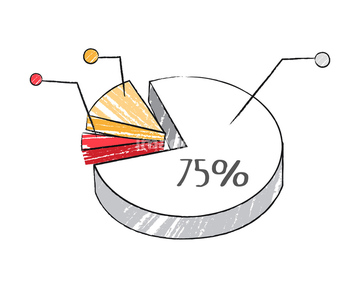
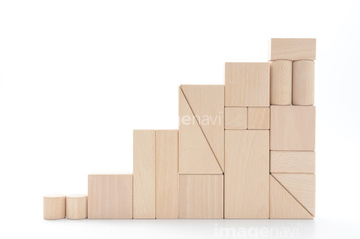
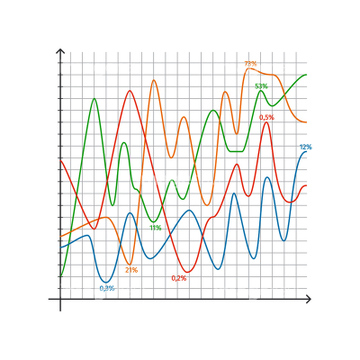
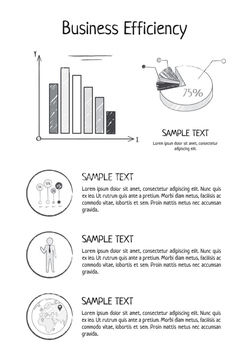
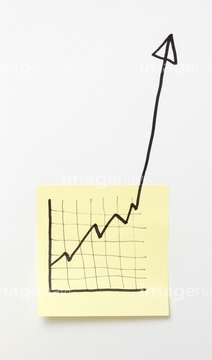
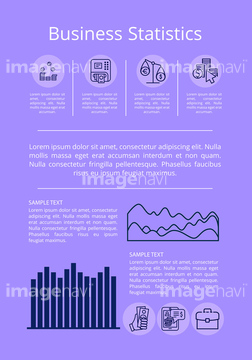
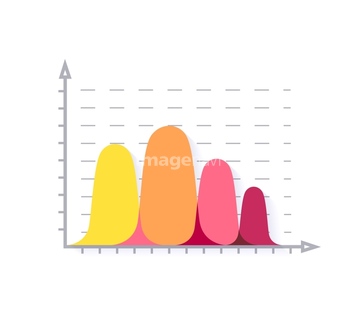
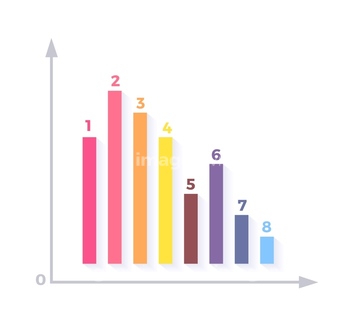
‚±‚جŒںچُŒ‹‰ت‚ة‚حپAƒrƒWƒlƒXƒCƒپپ[ƒWپ\ƒXƒeƒbƒvƒAƒbƒvپEچى‹ئƒvƒچƒZƒXپAƒrƒWƒlƒXƒCƒپپ[ƒWپ\چى‹ئچH’ِ‚ئژٹش‚جٹا—پAƒrƒWƒlƒXƒCƒپپ[ƒWپ\ƒvƒچƒZƒXپEƒXƒeƒbƒvپAƒrƒWƒlƒXƒCƒپپ[ƒWپ\ƒOƒ‰ƒt‚ئƒvƒچƒZƒXپAƒrƒWƒlƒXƒCƒپپ[ƒWپ\ƒvƒچƒZƒXپAƒrƒWƒlƒXƒCƒپپ[ƒWپ\ƒvƒچƒZƒXپEƒXƒeƒbƒvƒAƒbƒv‚ب‚ا‚ھٹـ‚ـ‚ê‚ؤ‚¢‚ـ‚·پB


31601074

31601075

31601076

31601077
31522467
31522468
31522469
31522470

31496073

31496074


31246161
31353911


31137426

31137427

31137428

31137430

31135069

31479108

31479109

31484231

31484232

31484233

31484234

31484237

35775421

35775422

31135066

31135068


31288111

31481647

31481648

31481649

31481650

31481651

31481652

31481653

31481654

35616331

35616332

31135483


31148807

31148808


31199821

31199822

31199823

31199824

31199825

31199826

31137871

31137872

31137873

31137874

31137875

31137876
31137877


35772613
35772614

31352535

31352536

35606235

31137797

31137798


31135067

31137429

41332444

31319357

31570864

31570865

31570866

31570867

31570868

31570869

31570870

31570871

31570872


31353877

31133455
31123792


31479090

31479091

31479092

31479093

31479094

31479095

31479096

31479097

31479098

31479099

31479100

31479101

31479102

31479103

31479104

31479105

31479106

31479107

31484235

31484236

31484238


31605280

31605281

31605292

31605293

31605294

31605295

31605296

31605297

31605298

31605299

31660107

31123834
31379989
31379990

31353874

41043727

29039910

30433424


31288553

31288554

31129058

31129059

31129060

31129062

31124624

31124627

31128136

31128163

31128164


31660105

31660106

35792134


29038806


16962938


31667922

40870879

40870880

40870881

41086810

41086811

41086813

41086816

41086820

41086822

41292896
| ژںƒyپ[ƒW |
