HOME > ژتگ^ > ƒrƒWƒlƒX > ƒrƒWƒlƒXƒCƒپپ[ƒW > ‚¨‹àپEƒRƒXƒg
10,000Œڈ‚جژتگ^‘fچق‚ھŒںچُ‚³‚ê‚ـ‚µ‚½پB
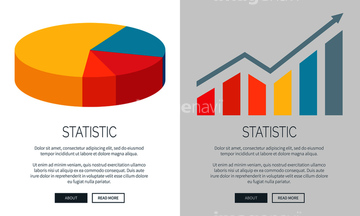
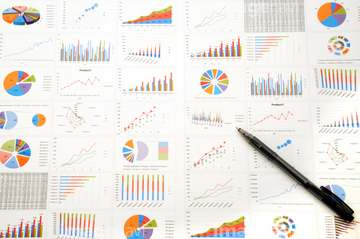
‚±‚جŒںچُŒ‹‰ت‚ة‚حپA“ْ–{‚ً•ھگح‚·‚éƒCƒپپ[ƒWپA“ْ–{’nگ}‚ھ•`‚©‚ꂽƒuƒچƒbƒN‚ئƒrƒWƒlƒXƒ`ƒƒپ[ƒgپAƒrƒWƒlƒXƒCƒپپ[ƒWپ\ƒrƒWƒlƒXژ‘—؟ پA’ژٹل‹¾‚ئ—lپX‚بƒOƒ‰ƒtپ\•ھگحƒCƒپپ[ƒWپAƒrƒWƒlƒXƒCƒپپ[ƒWپ\•ھگحپE’ژٹل‹¾‚ئƒOƒ‰ƒtپAƒrƒWƒlƒXƒ`ƒƒپ[ƒg‚جƒoƒbƒNƒOƒ‰ƒEƒ“ƒh‚ب‚ا‚ھٹـ‚ـ‚ê‚ؤ‚¢‚ـ‚·پB

35799569

35799568


35799570

31135067

35624598


31137429

35624597

35757913

35757914

31288554

31124624

31124637

31128136

31128163

31128164

31403323

31403324


29204052

31135069
29089720

29176127

29176129

29176133

29176138

29176144

29176147

29176150

29176153

29176156

29176163

29176165

29176167

29176170

29176172

29176174

29176177

29176180

29176186

29176262

29176267

29176271

29176277

29176279

29176289

29176291

29176293

29176296

31288553

31129058

31129059

31129060

31129062

31124627

31137426

31137427

31137428
31137430

29176284

31135066


31403980


29155440


35805977

31775455

31726556


41086810

41086811

41086813

41086816

41086820

41086822

31660107

31539540

31539541

31539542

31539543

31539544

31539545

31539546

31539547


32861191


31323346

31323347

31313676


| ژںƒyپ[ƒW |
