HOME > 写真 > イラスト・CG > ビジネス > ビジネスイメージ
10,000件の写真素材が検索されました。
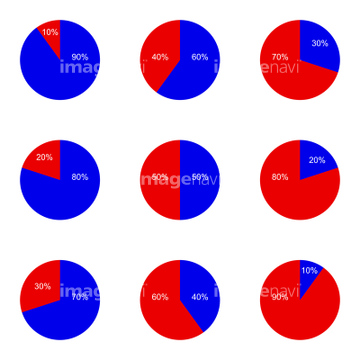
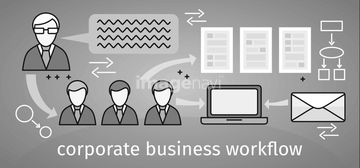
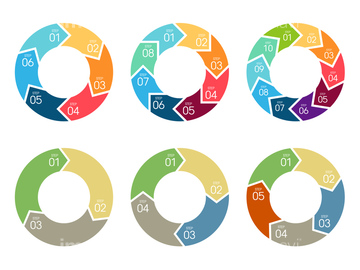
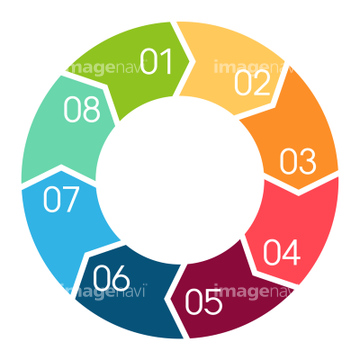
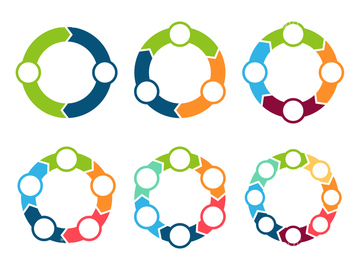
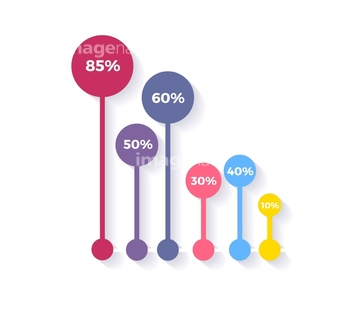
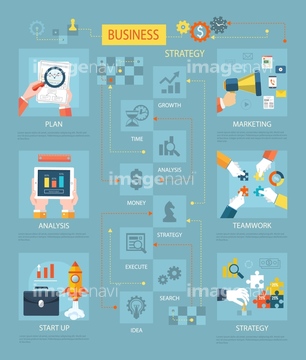
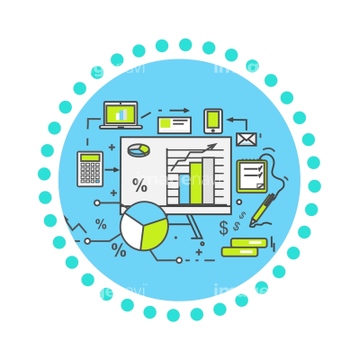
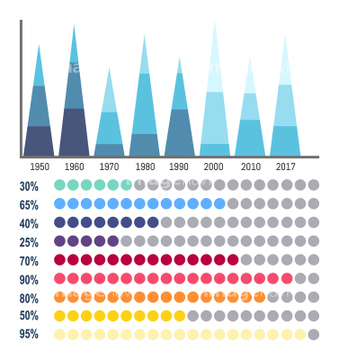
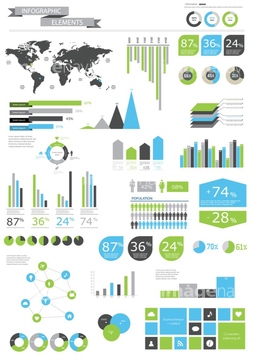
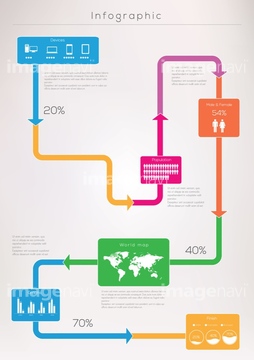
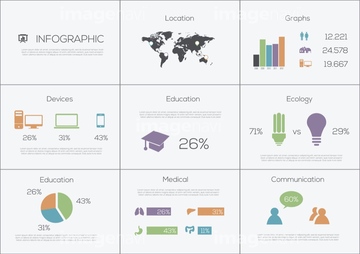
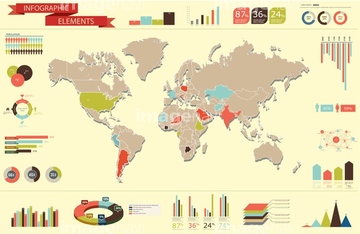
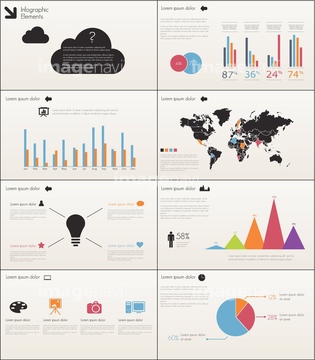
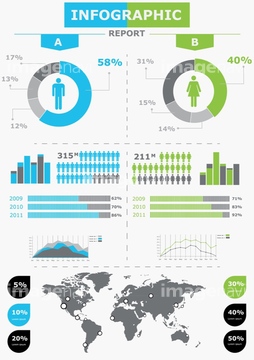
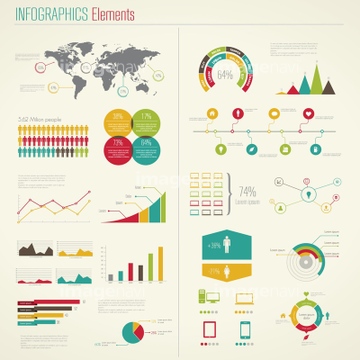
この検索結果には、戦略のコンパス、割合が10%から90%までの円グラフのイラスト、ビジネスのパズル、ゴールのコンパス、計画のパズル、矢印 循環 輪などが含まれています。
40629088
40548118
31508389
40629060
40629078
40629085
40566478
40548119
40548708
19072241
19072242
40629061
15801806
41201260
41201261
41201262
30062228
20528033
20528034
40586902
40629083
29112618
29113601
31040753
41069481
41069482
40548102
41356973
41356974
29041647
40629077
17275109
29048517
29048565
41448651
41448652
40548695
40548696

40548866
31683183
31683485
31683486
40529211
40663251
40663253

29044702
17277110
41357003
41357004

29091534

40629064
29047889
29043135

29044129

40526362
40629101
17275828
40653560
35775289
35775290
64231875
40500711
41577735
41577737
29045122
20564457
40629063
11614920
11614921
11614922
14402381
11614923
64238672
11855164
29047866
29047868
29048071
29048135
29048357
29048362
29048399
29048615
19065630
29044726
29044727
29044728
29044729
29044730
29044731
29044732
29044733
29044734
29044735
29044736
29044737
29044738
29044739
29044741
29044742
29044743
29044744
29044745
| 次ページ |
