HOME > 写真 > イラスト・CG > CG > 3DCG
10,000件の写真素材が検索されました。
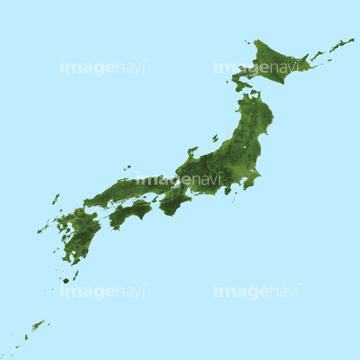
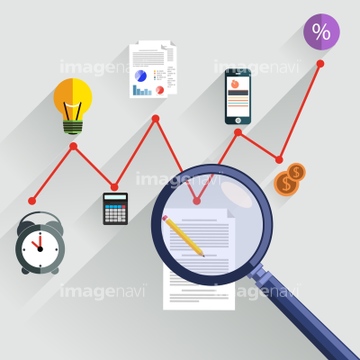
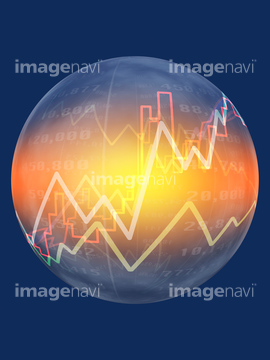
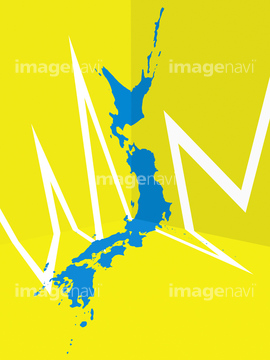
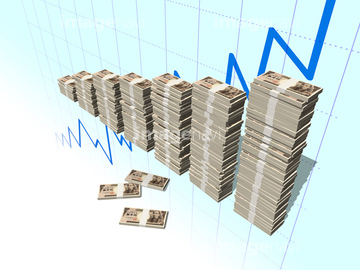
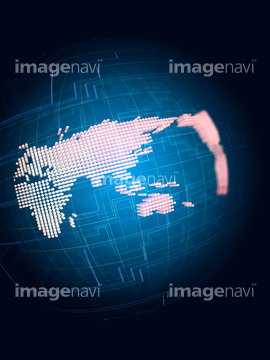
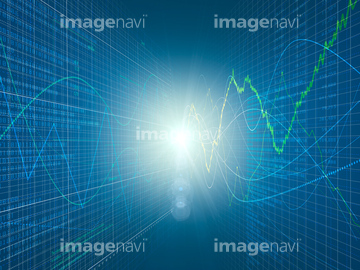
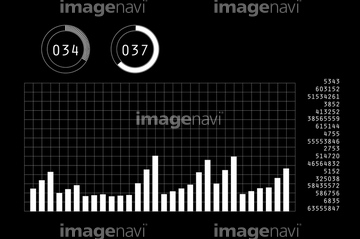
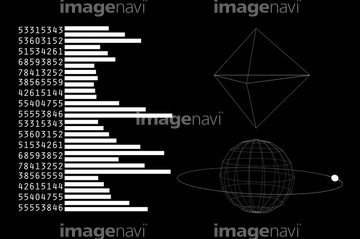
この検索結果には、円グラフ、円グラフと棒グラフ CG、グラフ、日本列島の地図、グラフ表示された空間、球体にグラフ線などが含まれています。
41356881
41356882
11614923
11855610

11855611
41323596
41323597
41323598
41323599
41323600
41323601
41369220
11855173
11855180
11855160
41356957

11855603
11855157
11855229
11855604
41369218
41369219
41369245
41369246
41369247
41356989
41357772
41357773
11855605

11855167

11620339
11620340
41356958
41356959
41356960
41356973
41356974

11855203

11855204
11855230
11855234
11855235
11614920
11614921
11614922

11854985
11855146

11855168

11855171

11855197

11855198

11855199

11855200

11855201
11855205
11855206
11855207

11855209
11855231

11858235
11858240
41323466
29089260
11855159

11854986
11619932
11619933
11619934
11855166
11859255
11859257
11855227
41357003
41357004
41356986
41356987
41356988
41357006

11855210
11620338

11619903

11619904

11855202
11614931
11620395
11620396

29667373

11854982
11855164
11855608

11855609
11855612
11855142

11855291
11859251
40007438
40007440
41357063
41357064
41356995
41356996
41356997
21940203
21940204
64238672
24893959
24893960

11855599

11855600

11855601
11855606
11855607
29667570
29667535
11855602

11855175

11855212

11620736

11619905
11855174
11855176
41369169
41369170
41369171
17262010

20561497
20561500

20561501

20561502


11620744
11855192
11855163
11855189
11855190
11855208
41356975
41356976
41356977
41356978
20525470
20525471

41290972
17284016

41323459

41323460

41323461

41323462

41323463

41323467

41323505

41323506

41323508
41323549
41323550

41323551

41323552

41323553

41323554

41323555

41323556
| 次ページ |
