HOME > 写真 > イラスト・CG > CG > 合成写真
10,000件の写真素材が検索されました。
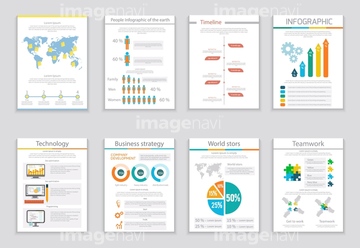
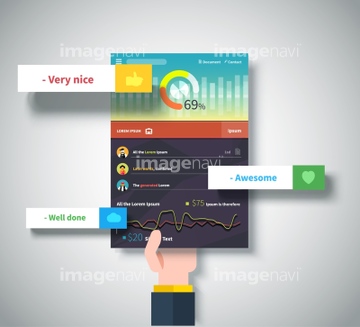
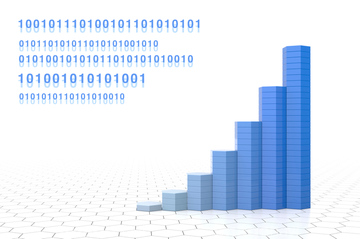
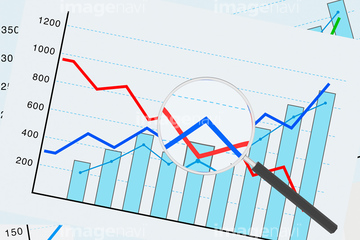
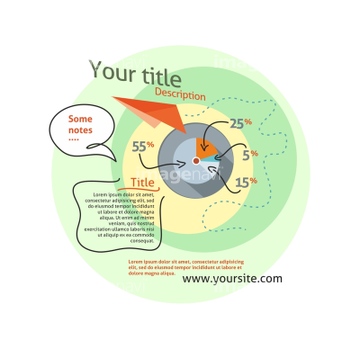
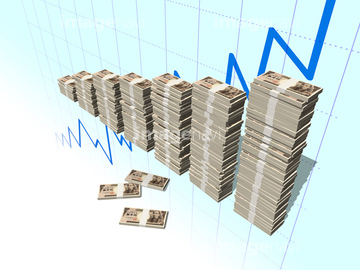
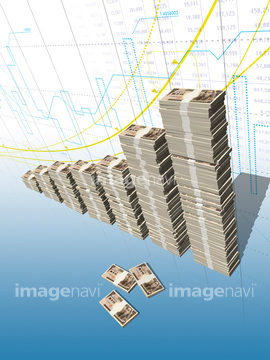
この検索結果には、棒グラフ、波形、株価グラフ、グラフと矢印、グラフと株価、パソコンと株価などが含まれています。
41369169
41369171
41369170
41369111
41369112
41369113
41369114
41369115
41369116
41369117
41369118
41369119
41369120
41369121
41369122
41369123
41369124
41369125
41369126
41369127
41369128
41369129
41369130
41369131
41369132
41369134
41369135
41369136
41369137
41369138
41369139
41369140
41369141
41356957
41356958
41356959
41356960
41356973
41356974
41369104
41369105
41369106
41369107
41369108
41369109
41369110

41369142
41369143
41369144
41369225
41369226
41369227
41369228
41369229
41369230

41356986
41356987
41356988
41357006
41369133

20561497
20561500
20561501
20561502
20525471
11855233
11619934
41369100
41369101
41369102
41369103
20525470
41356975
41356976
41356977
41356978

11619903

11619904
11855203
11855204


11619936
11614931
11855173
11620338
11620339
11620340
11620341
11620342
11619935
11855232
11619932
11619933

17269272


11855234
11855235
11620736
11855205
11855206
11855207
41323596
41323597
41323598
41323599
41323600
41323601
41369098
41369099
11855222
11855159
11620744
35608497
11855189
11855192
11614932

29085403
11855180

11855190
11855191
11855193
11855194
11855195

11619905
11614923
11855196
29089260
11855167


35608498


35635542
41369167
41369168
11855177
11855178
11855179
11855197
11855198

11855153
11855210
24884855
11855150
11855151
11855154

11855168
| 次ページ |
