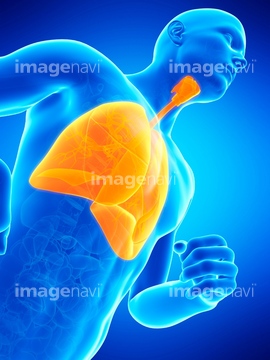
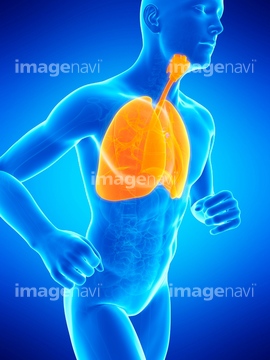
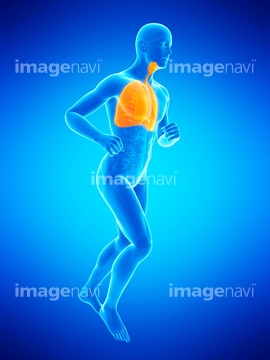
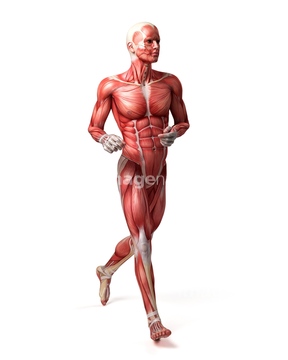
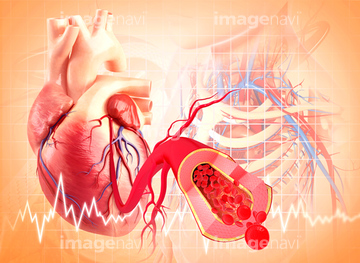
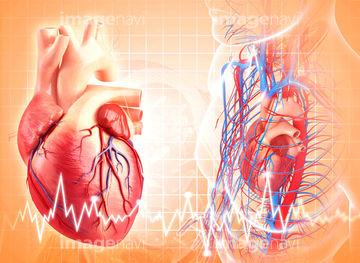
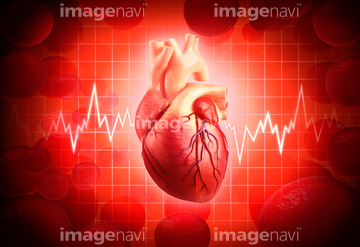
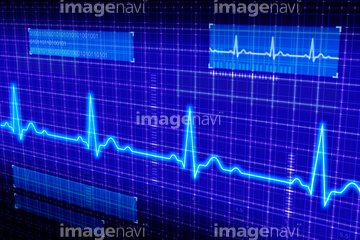
HOME > 写真 > イラスト・CG > CG > 医療・健康のイメージ
10,000件の写真素材が検索されました。
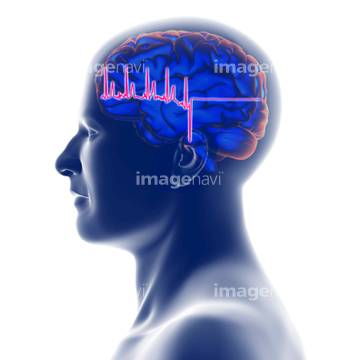
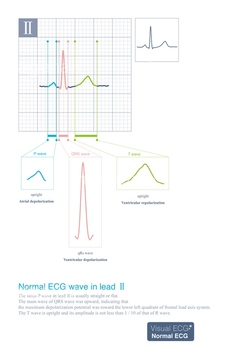
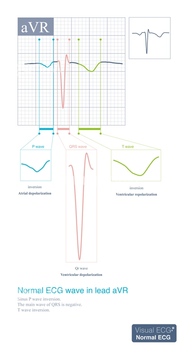
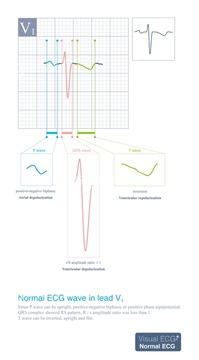
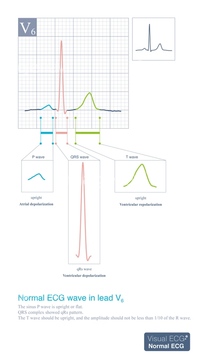
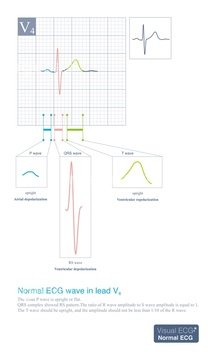
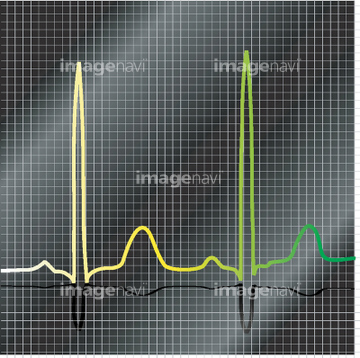
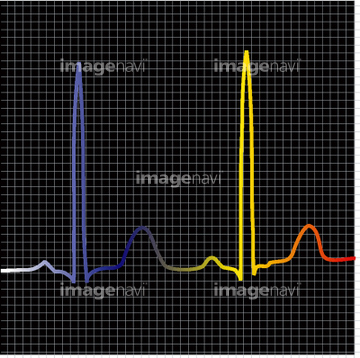
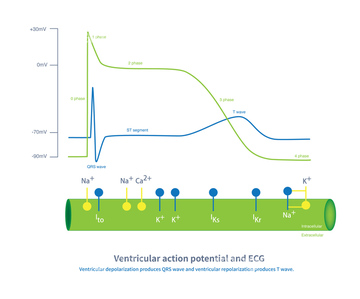
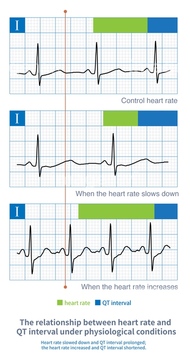
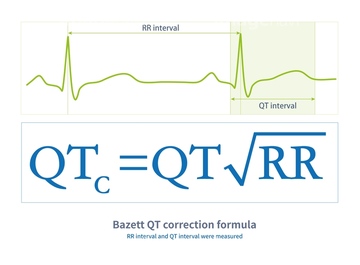
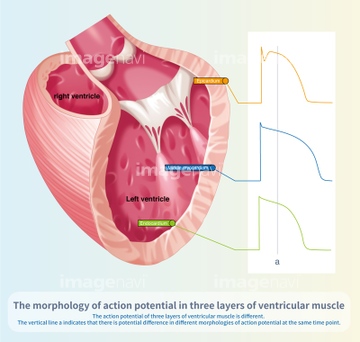
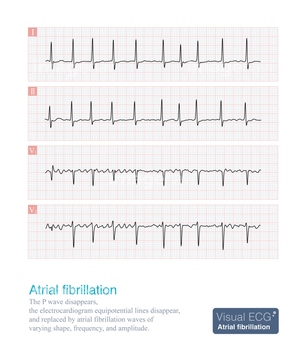
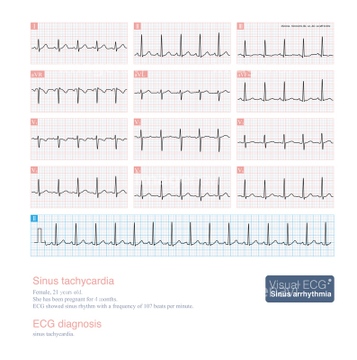
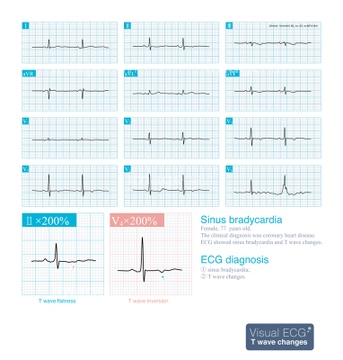
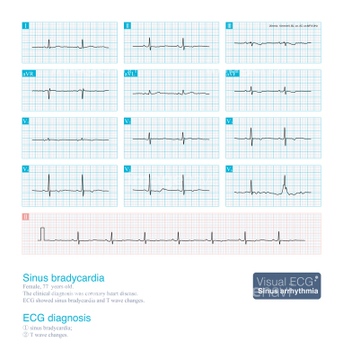
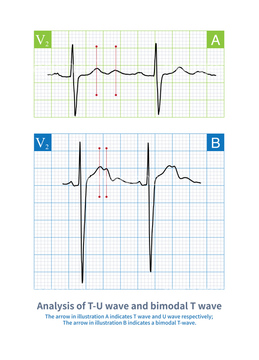
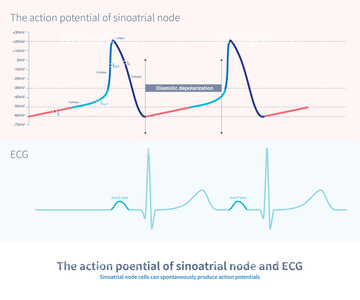
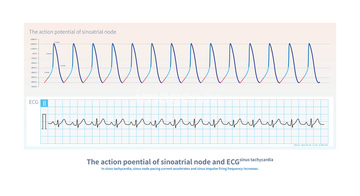
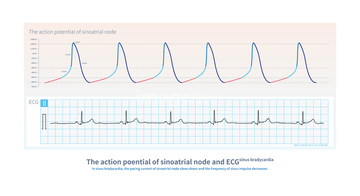
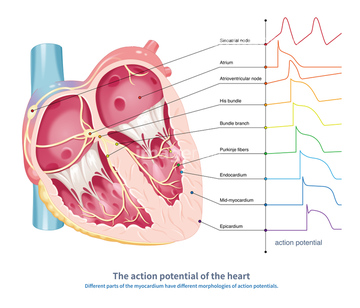
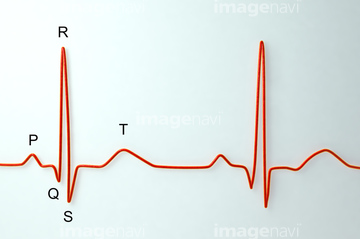
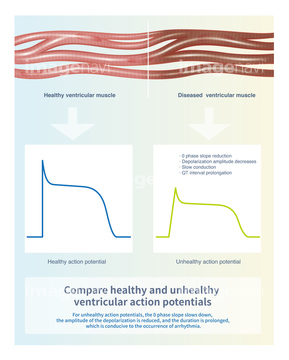
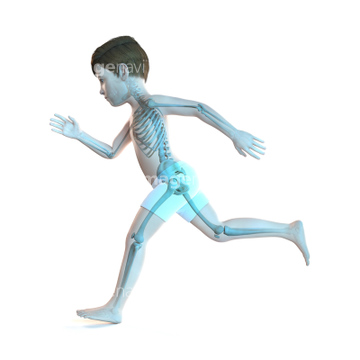
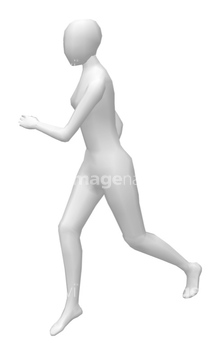
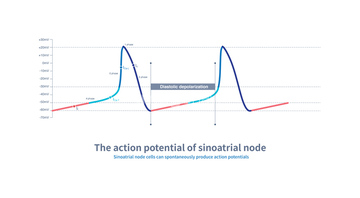
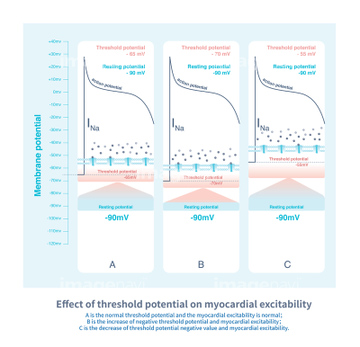
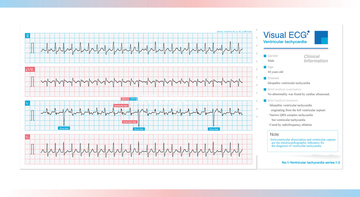
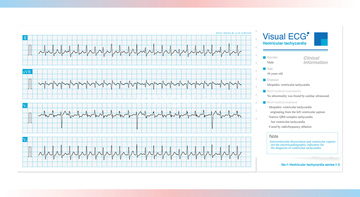
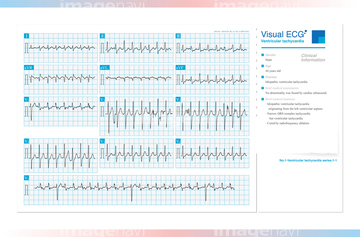
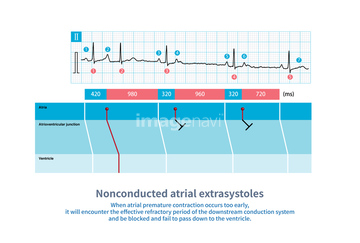
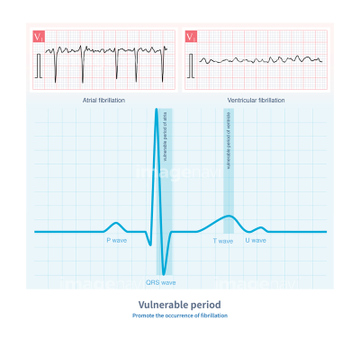
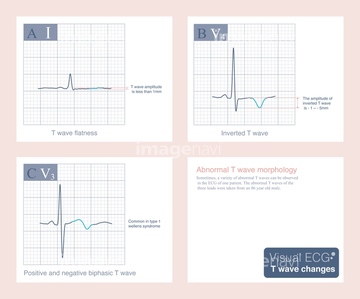
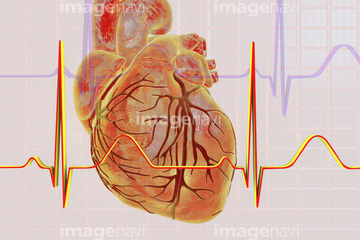
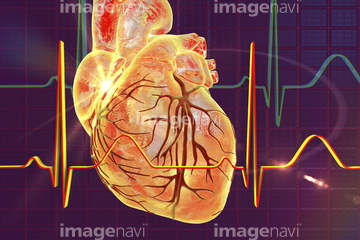
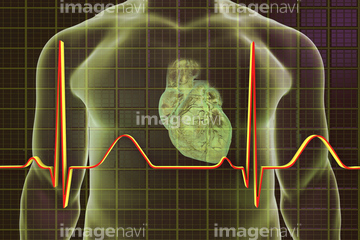
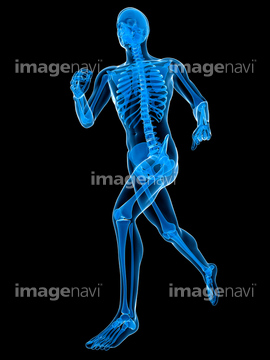
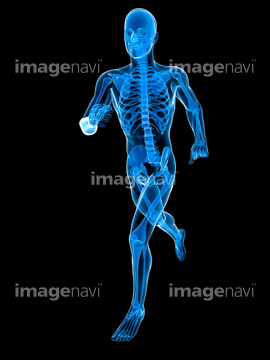
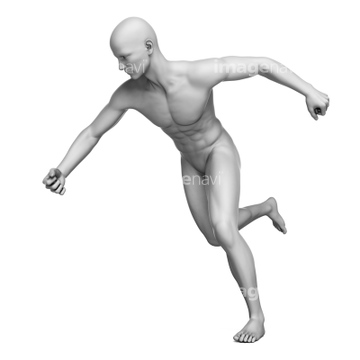
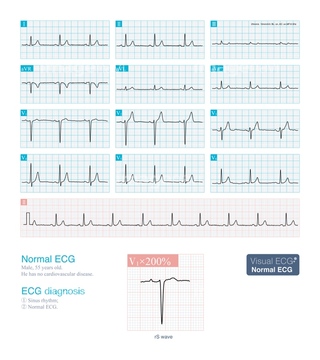
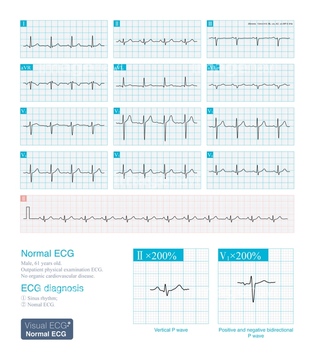
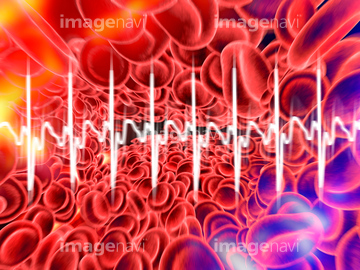
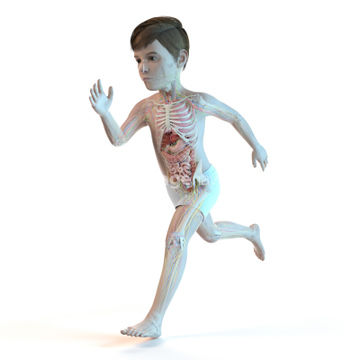
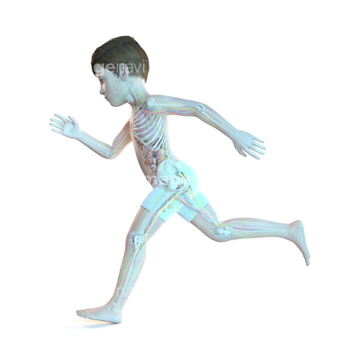
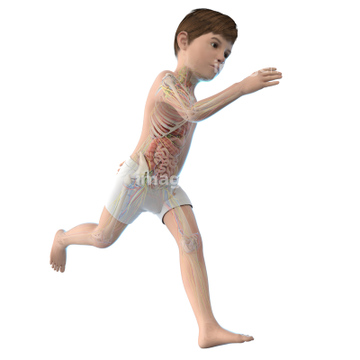
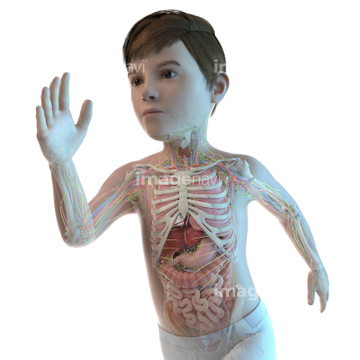
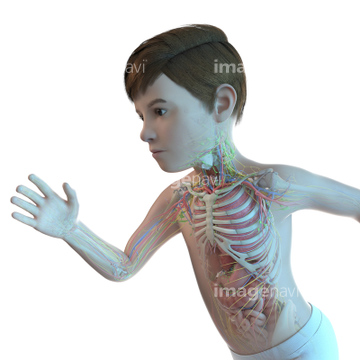
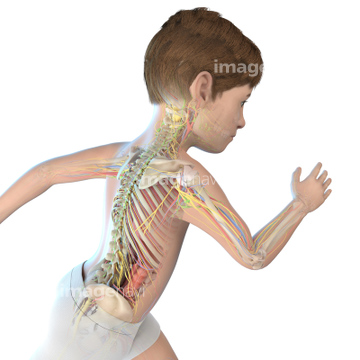
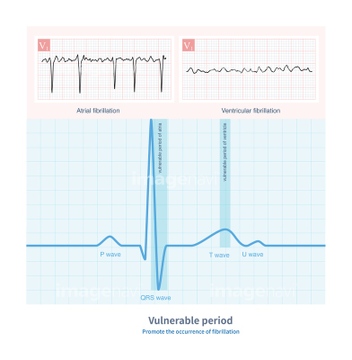
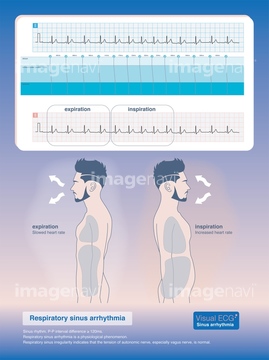
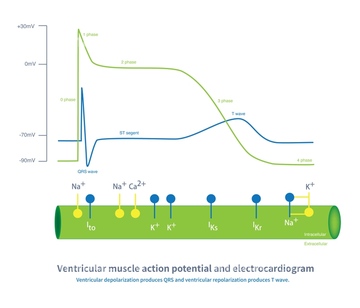
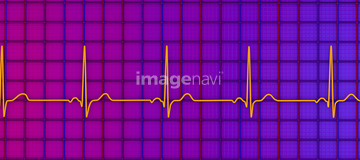
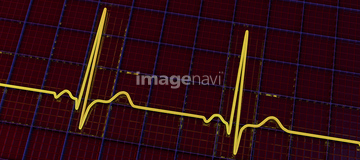
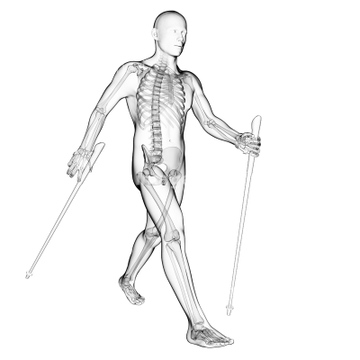
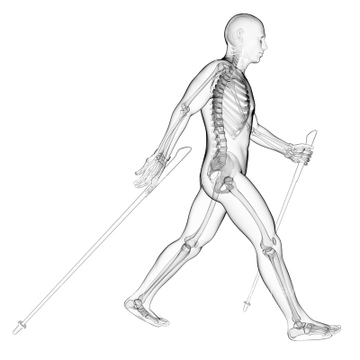
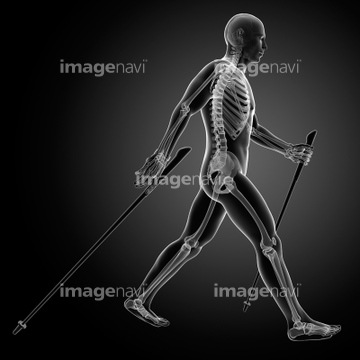
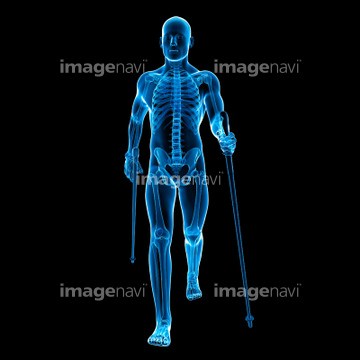
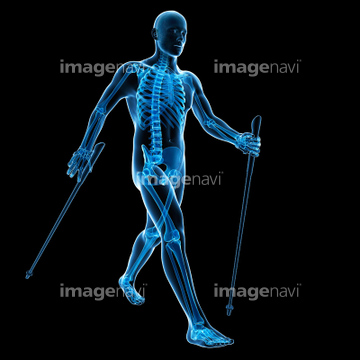
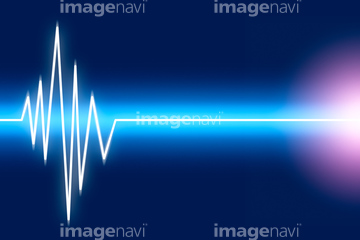
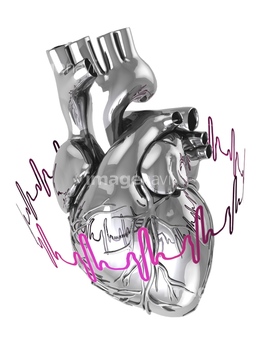
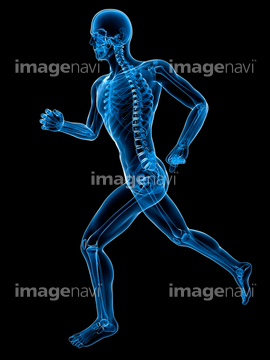
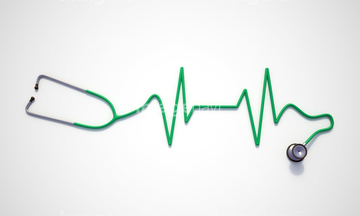
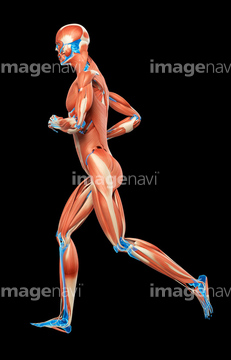
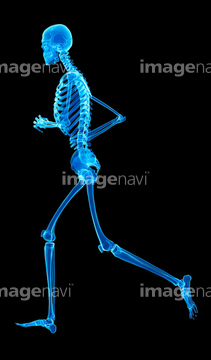
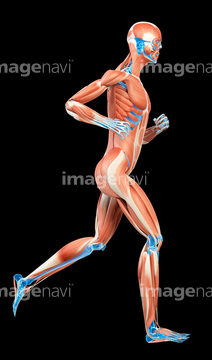
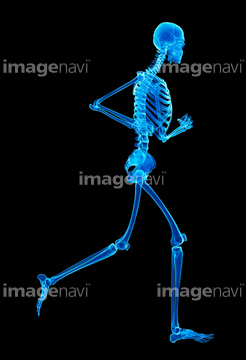
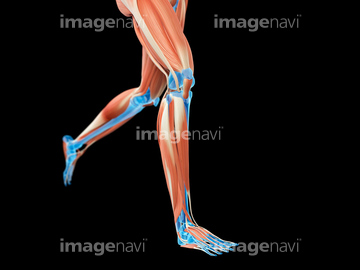
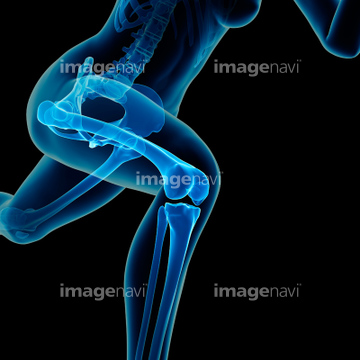
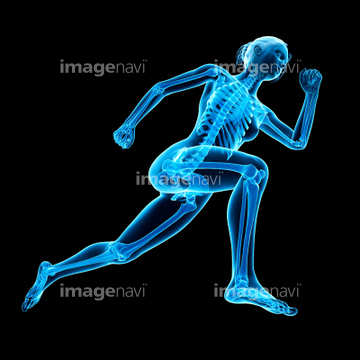
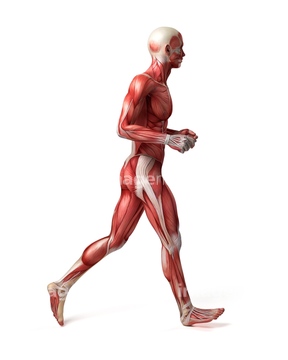
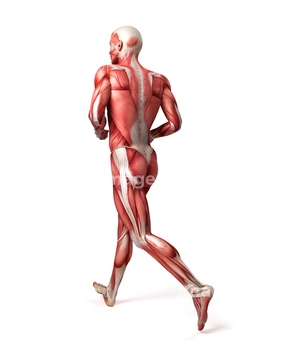
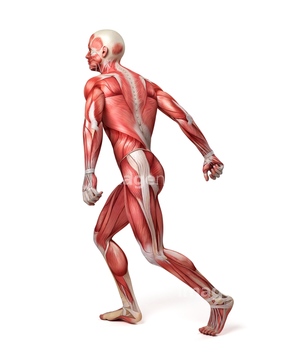
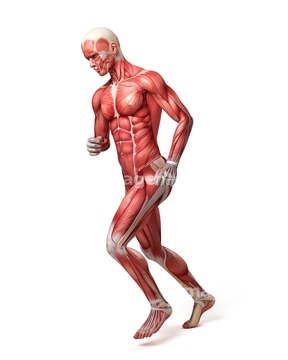
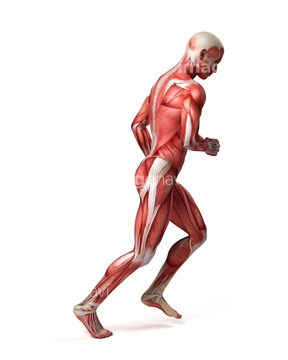
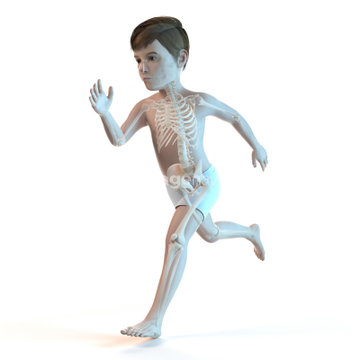
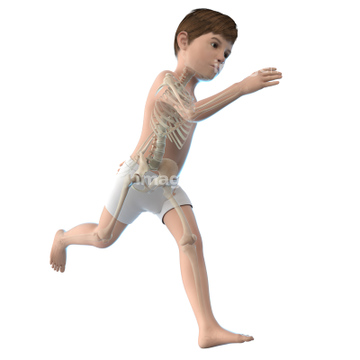
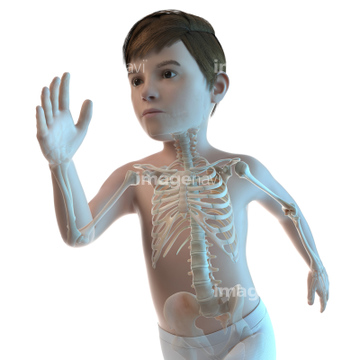
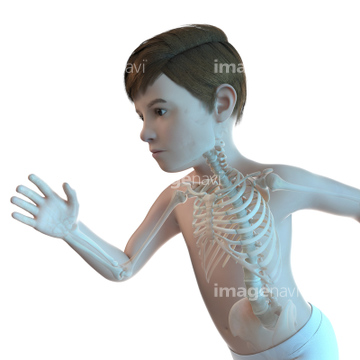
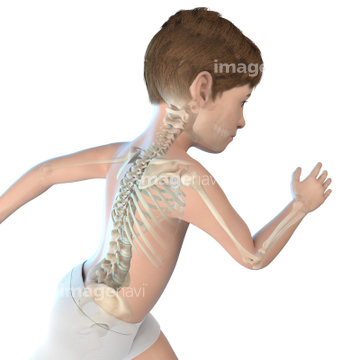
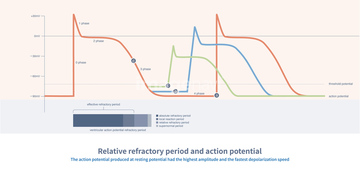
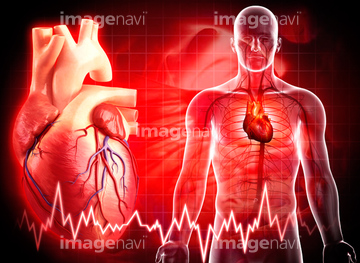
この検索結果には、心電図、Action potential of the heart, illustration、ECG, illustration、Healthy and unhealthy ventricular action potential…、Illustration of a boy's skeletal system、ホワイトモデル 走るなどが含まれています。
64019243
64019242
64019244
64019245
64019241
17200136
17200168
17200169
64019246
64021338
64021347
64019240
64021342
64021343
64021345
64021346
41526438
41526439
64021339
64021344
64255570
17213211
10919268
17200615

64222122
64222133
64222139
64222140
20566906
17267302
17267303
17267304
17267305
17267306
17267307
17267308
17267309
17267313
17267314
17267315
40907804
54004400
64222153
64255596
64255598
11610793
11610794
17213122
17213317
17213813
17214007
17215182
17215183
64021340
64255569
15802408
17267310
17267311
17267312
11615036
64019235
17208058
17208060
17208061
17208062
17244906
64222161
64222164
17200083
17200085
20551117
20551120
20551123
64222142
10919305
10919322
17205257
17205258
17230035
17230036
17230059
17230060
17230062
17230064
17230065
17230066
17230067
11619022
17270791
17208059
17219522
17244394
17244395
17244396
17244719
17244720
17244721
17244724
17244737
17244738
20551125
17213209
17213313
17213315
17213531
17213807
17214286
17214491
17215093
11613438
64015437
17217249
17217250
10919252
10919255
10919278
64222112
64222130
64222147
| 次ページ |
