HOME > 写真 > イラスト・CG > CG > 地球・宇宙のイメージ
10,000件の写真素材が検索されました。
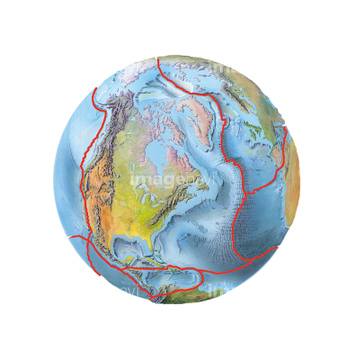
この検索結果には、未来イメージ、海と世界地図、世界地図、日本地図(CG)、CGイメージ、International air travelなどが含まれています。
64037982
64037983
64037984
64037981
64037729
64037730
64015329
64015330
64015331
17206203
64037910
64015612
64037915
64039535
10305800
19283321
40025867
40025868
40025869
10017016
64024084
64024085
64024086
64024087
64024088
64024089
64024090
64024091
64024092
64024093
64024479
64024480
64024481
64024482
64024572
64024573
64024574
64024575
64024802
64025046
64025047
64025048
64025049
21850489
10927452

11615613
10130594
19283320
21850488
64045616
64045617
64045618
64045621
64045622
64045623
40025011
40025012
40025013
11615452
20534116
40025006
64025355
64025356
11611514
64015386
64015404
64015405
11615453
11611480
11611481

11611513
11611516
11850079
11615454

11615608

11615609

11615612
11611489
17206512
10017011
10017048
10017049
10017050
10017051
10017052
10017053
10017054

10017055
10994729
10918150
31156324
31156325
31156326
31156327

31169946
31169947
31169948

31169949
31169950
41509336
41509337
41509338
41509339
41509340
41509341
41509346

32430234

32430236
32430238

32430240
32430242
32432920
32432923
32432931

32432941
32432942
32432956
32432957

32432976
32432977
32434075

32434076

32434077

32434078
32434082
32434083
32434084
32434085
32434086
32437776
32437777
32436959
32436960
32436961
32436962

32436963
32436964
32436965
32436966
64000773
64015437
00036084
40034739
40048664
40079573
40079792
31170006
31170013
31170019
31170020
31170030
31170031
31170032
31170033
31170034
31170044

31170045
31170094
31170098
31170100
31170106
31170113
70097277
40031888
31170143
31170145
31170146
31170147
31170150
31170151
31170196
31170197
31170198
31170199
31170200
70097280
20573089

11850077
11611479
10305723
10123056

11614148

11614149
64047960
10017045

10155406
11611240
40851681
| 次ページ |
