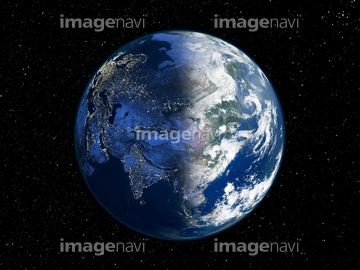
HOME > 写真 > 自然・風景 > 宇宙 > 地球
10,000件の写真素材が検索されました。
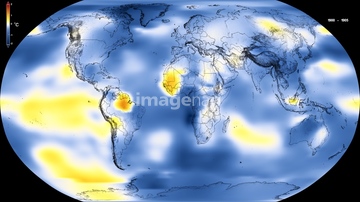
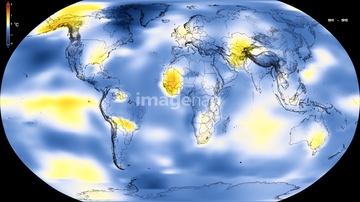
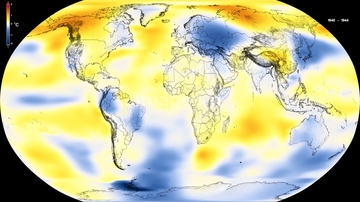
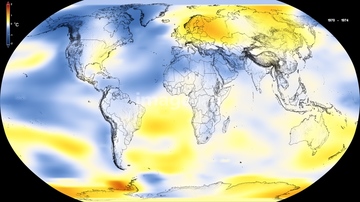
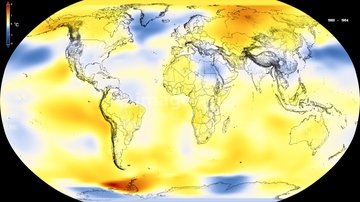
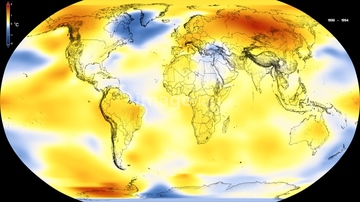
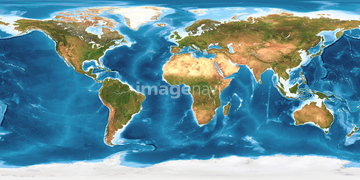
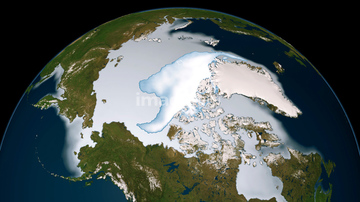
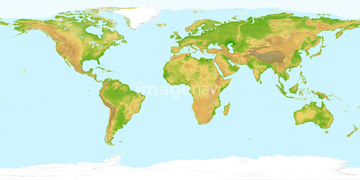
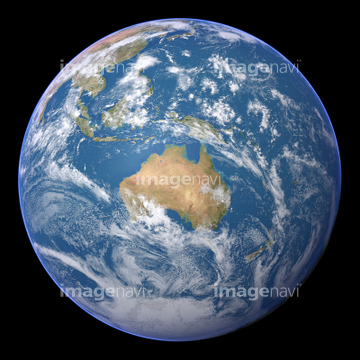
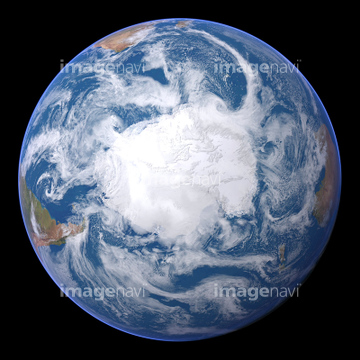
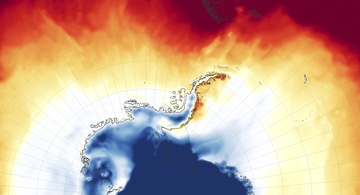
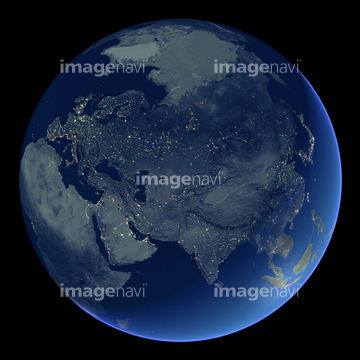
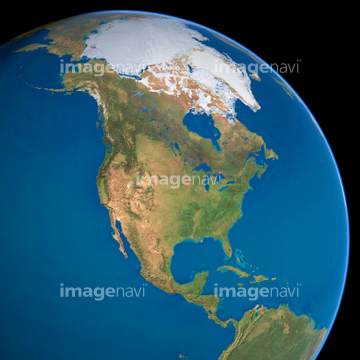
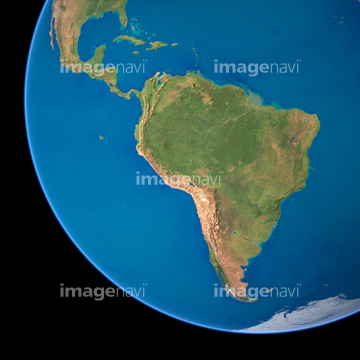
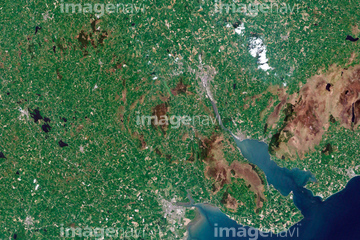
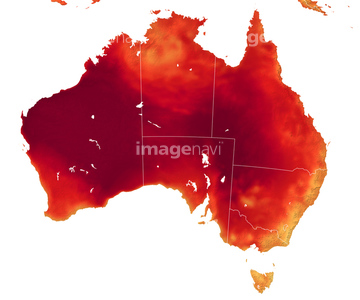
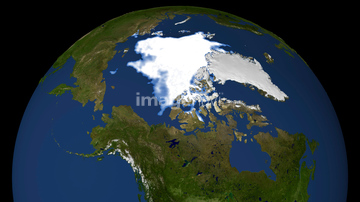
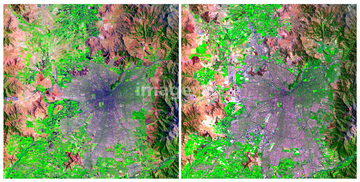
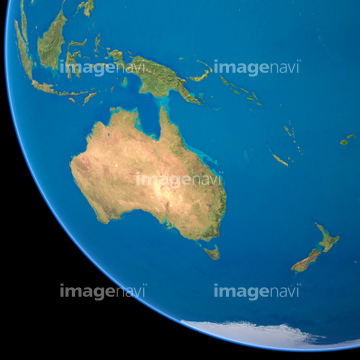
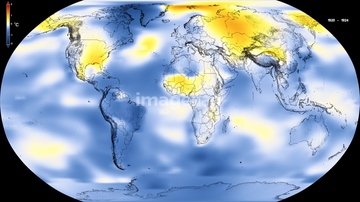
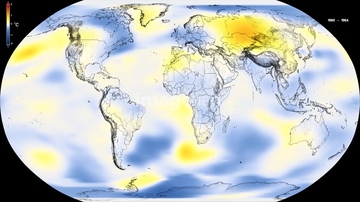
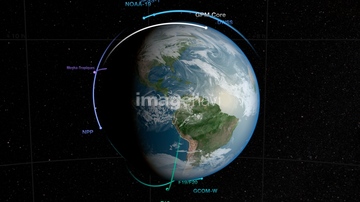
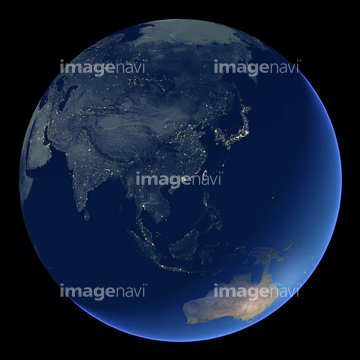
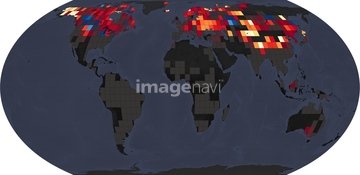
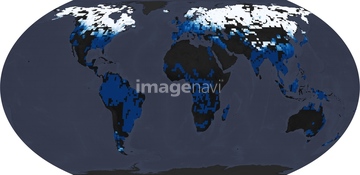
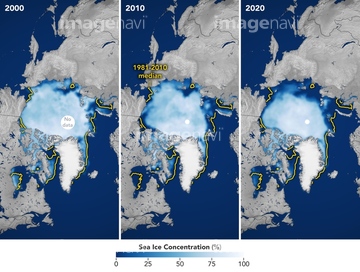
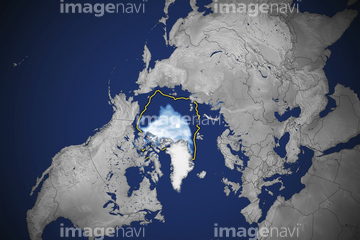
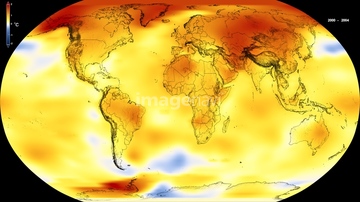
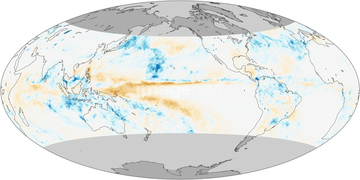
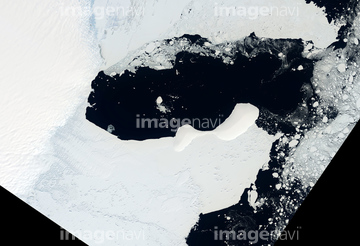
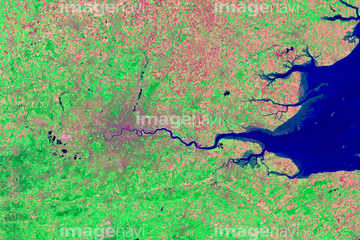
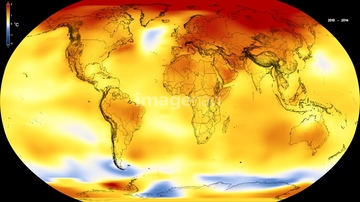
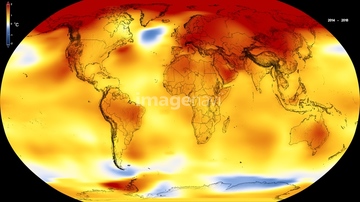
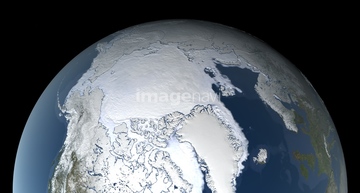
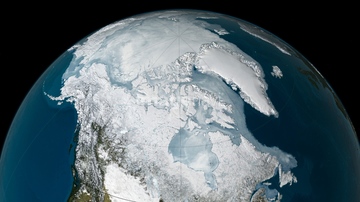
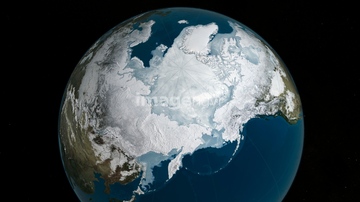
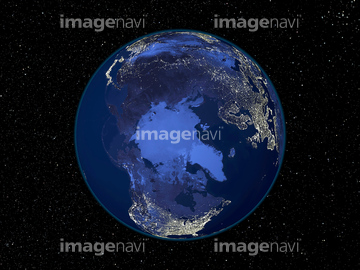
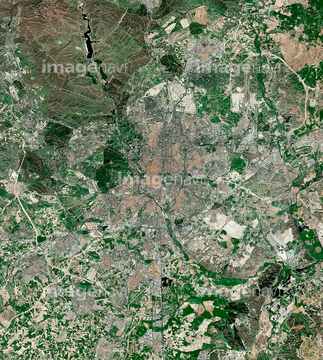
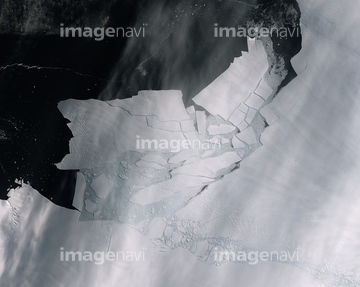
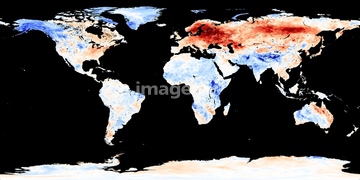
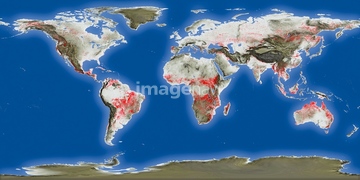
この検索結果には、Ring of Gullion, satellite image、Australian heatwave, 2022、Arctic sea ice, September 2008、Santiago, Chile, 1985-2010、Australia, satellite image、Global warming record, 1920-1924などが含まれています。

64041390
64041383
64041384
64011203
64011211
64011230
64011200
64088450
64074792
64074793
64040007
64040009
64040010
64040011
64040012
64040013
64040014
64040015
64040016
64011221
64011223
64011225
64011229
64040008
64116457
64116458
64185232
64185233
64185234
64185236
64185238
64185239
64185240

64041230
64059717
64041391
64041392
64040017
64040018
64210700
64074794
64011214
64011215

64011231
64053686
64257529
64015154
64057572
64011207
64185235
64185237
64074795

64014771
64204972
64088667
64014670
64058420
64058421

64109527

64109558
64258105
64043083
64242042
64040980
64088728
64185241

64109441

64109442

64109463

64109464
64011202
64011205
64011210
64040019
64074902
64046247
64047888
17200257
64168208
64043123
64014421
64040166
64040203
64040204
64040205
64040206
64041386
64041387
64041388

64109443

64109465
64067342
64067344
64075837
64045640
64045641
64045643
64045644
64045655
64109433
64109438
64109444
64109460

64109439

64109440

64109461

64109462

64109473

64109475
64051876
64253111
64253112
64045642
64258106
64185242
64185243
64215904
64092867
64092868
64075588
64075590
64047887
64062174
64062175
64111499
64041895
64044741
64053684
17200249
17200250
17200253
17200255
64059213
64057614
64149307
64105661
64053691
64053692
64082370
64045653
64045654
64109476
64040185
64040186
64135588
64098673
64098684
64011094
64011098
64011100

64109563
64200497
64062428
| 次ページ |
