HOME > 写真 > イラスト・CG > 自然・風景 > 宇宙
10,000件の写真素材が検索されました。
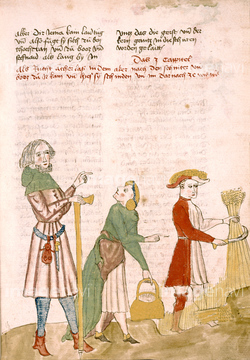
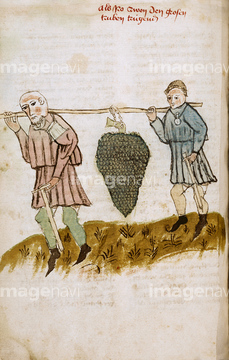
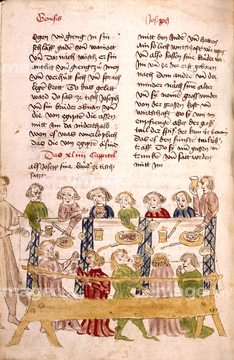
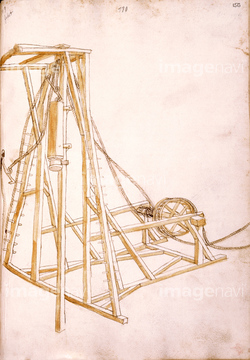
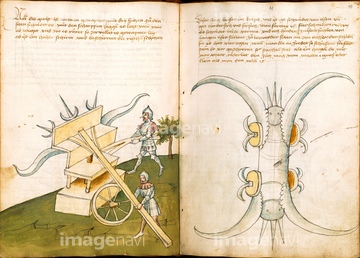
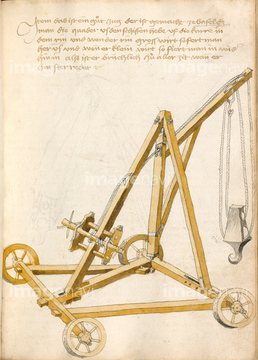
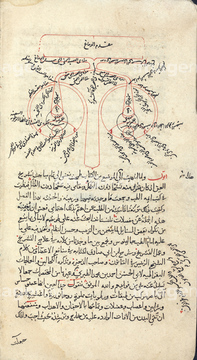
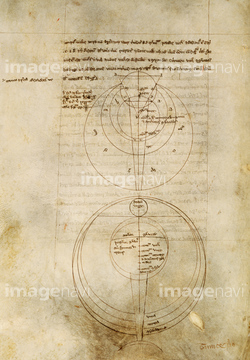
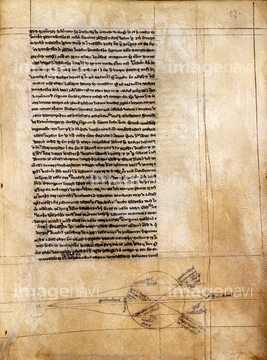
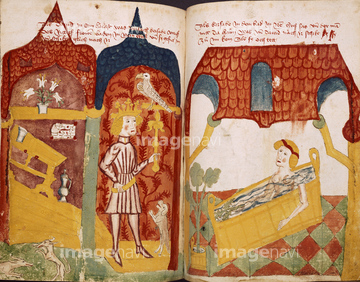
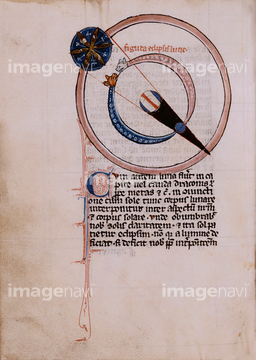
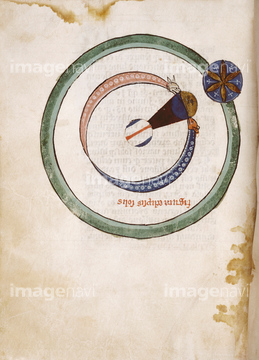
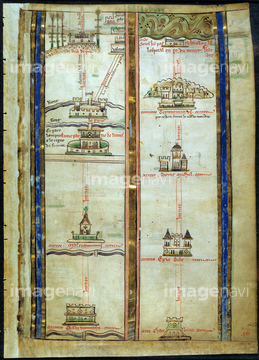
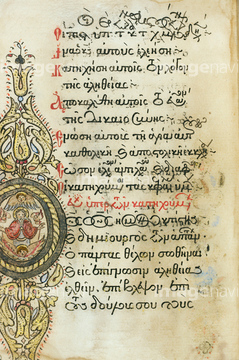
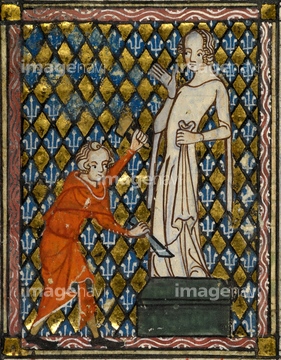
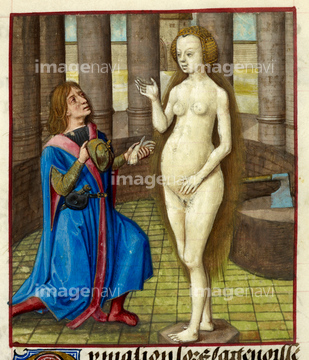
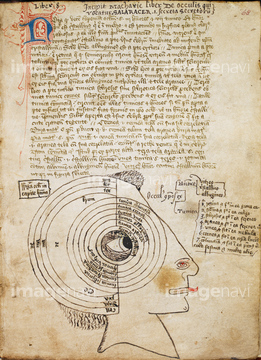
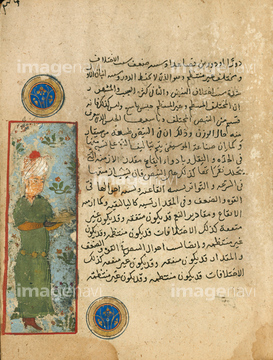
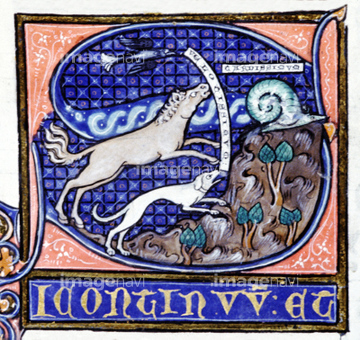
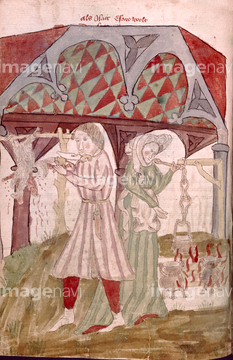
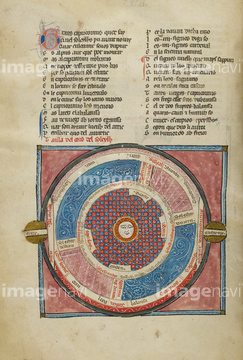
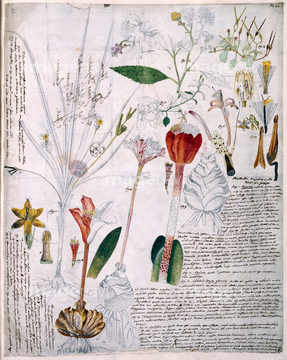
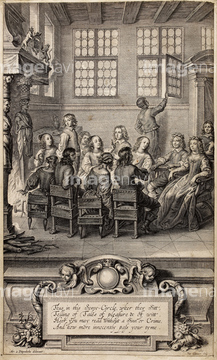
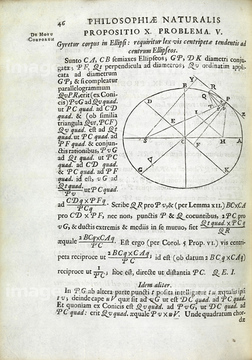
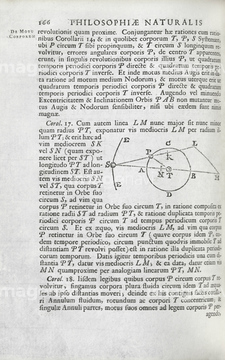
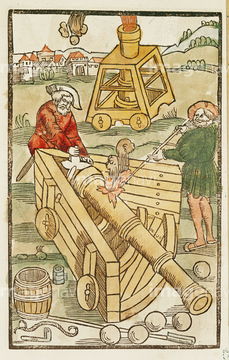
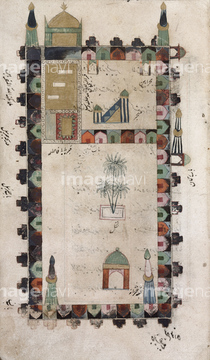
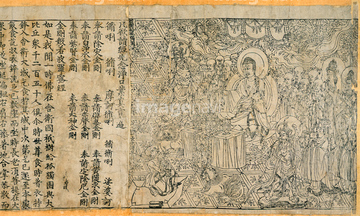
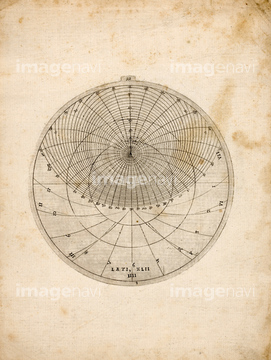
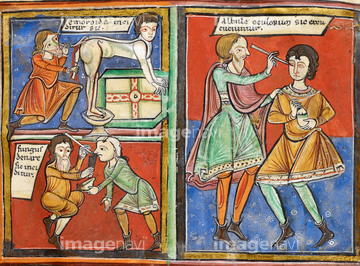
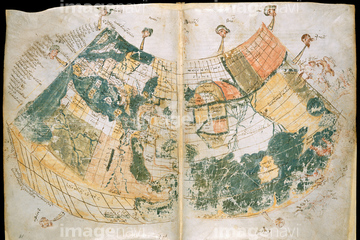
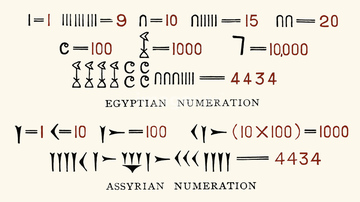
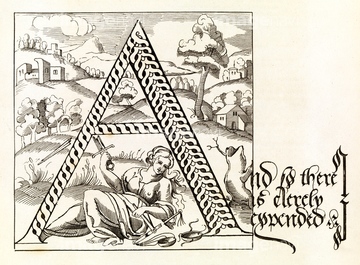
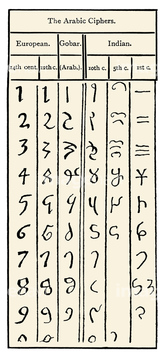
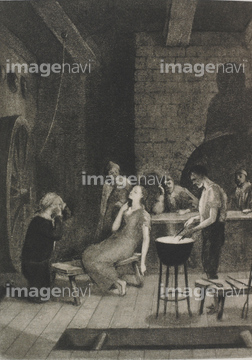
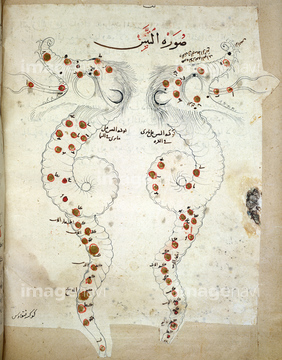
この検索結果には、Medieval woodcutter, artwork、Eye anatomy, 14th-15th century、Ancient Arabic manuscript、Mediaeval zoological manuscript、Medieval cooking, artwork、Sun's course, illustrationなどが含まれています。
64089010
64089032
64089033

64089034
64089013
64089018
64089035
64089037
64089058
64089082
64089011
64089075
64249100
64089025
64089027
64089028
64089070
64089095
64089096
17284616
64172005
20531568

20541762

64093494
64096211
64097768
64097778
64097785
64097796
64089090
64116988
64116989
64089016
64089026
64095591
64089071
64089251
64089029
64097626
64096216

64263733
64096300

64098328
64096212
64096213
64096214
64096234
64162609
64097779
17235644
64097767
64089097
64131835
64089091
64244112
64089069
64089062
64046259
64090285
64090286
64097772
64097776
64097791

64118476
64136415

17283582


17250056
29668688
64101111
64096226
64097771
41316812

41316813
41316814
30032839
64123898
64109403
64089074
64096302

64002824
64089089
64091695
64130086

18351383
64089063
64046257
64041686
64119758
64119759
64127163
64127164
64127165
64127166
64127167
64127168
64127169
64127170
64127171
64127172
64127173
64127174
64127175

19005102
64089060
64089899

64089902
20516698
30408498
30033743
17293350
64171995

64172006
64085202

17283580

17283581
17283583
17283584
| 次ページ |
