HOME > 写真 > 自然・風景 > 宇宙 > 地球
10,000件の写真素材が検索されました。
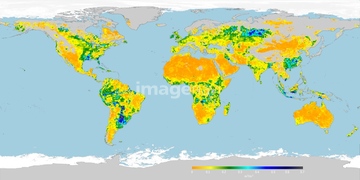
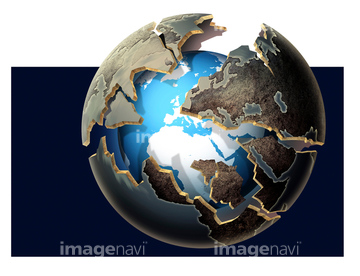
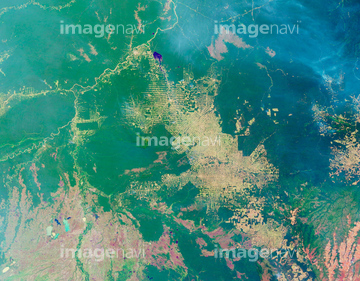
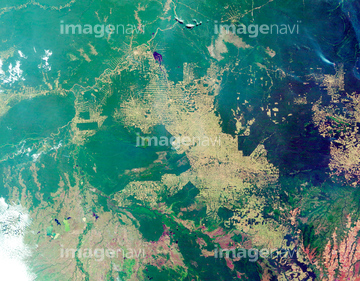
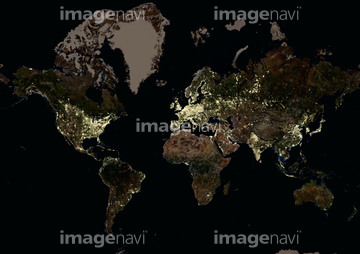
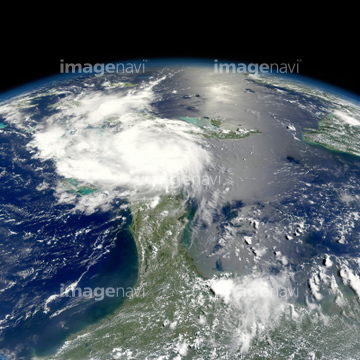
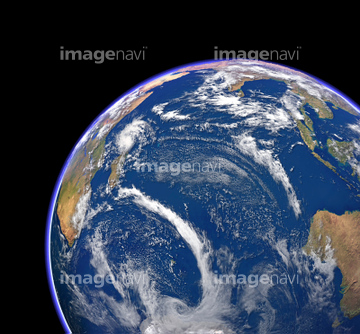
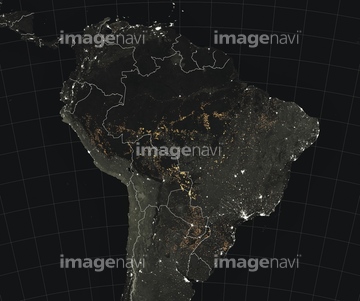
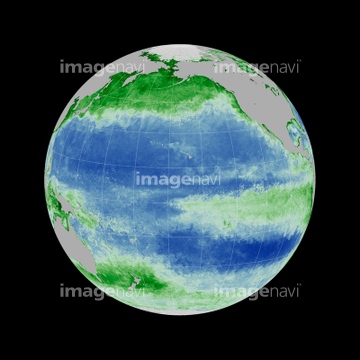
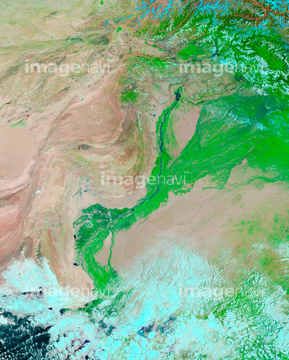
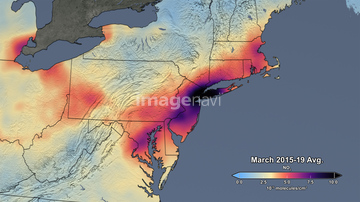
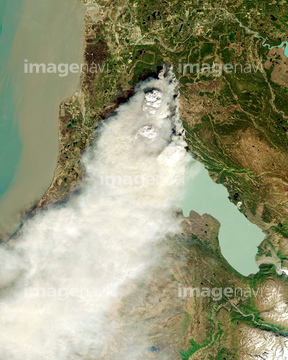
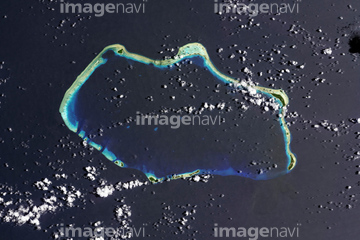
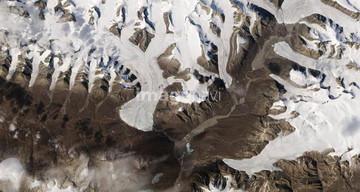
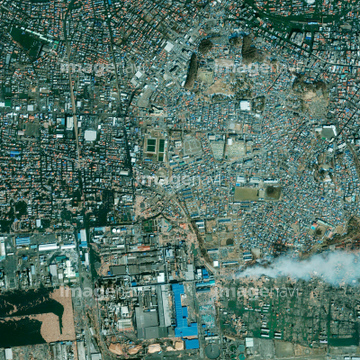
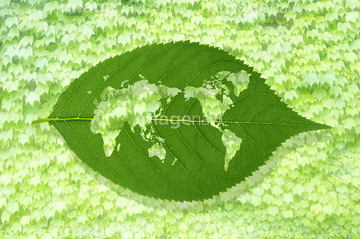
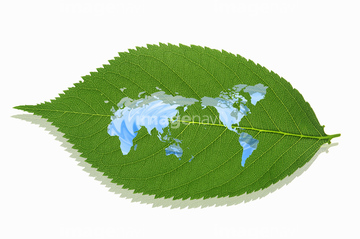
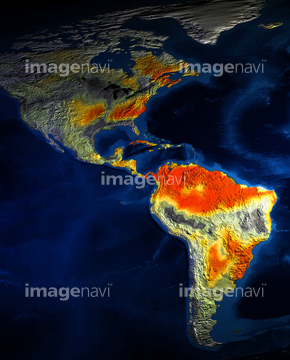
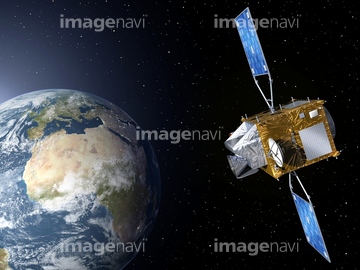
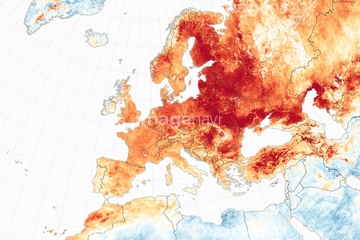
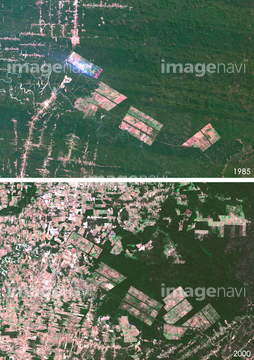
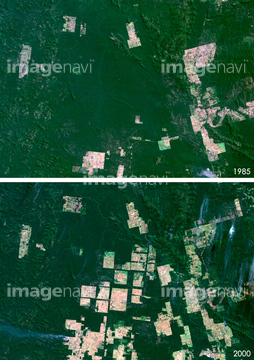
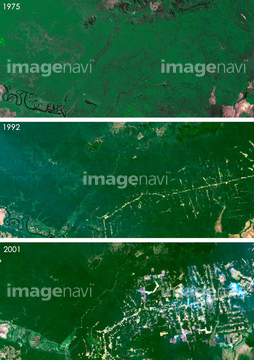
この検索結果には、地球と都会、グローバルイメージ、水の世界地図、粘土の地球儀、Mount Everest, satellite image、Amazon fire detections using satellite data, Augus…などが含まれています。
64131456
64079777

64109509

64109527

64109558
64064274
64061242
64075588
64075590
64072059
64072060
64098666
64067282

64220039
64046145
64084875
64076181
64014771
64075830
64049194
17200256
17200257
17200258

64109443

64109465
14915396
14915400
10328549
31169200
31169201
31169202
41181248
64086667

64109440

64109462

64106283
64098673
64098684
64098688
64098690
64098696
64098702
64116186
64116187
64116188
64200497
64170236
64057050
64170235
64062425
64062429
64109508

64041230
64073664
64086428
64075191
64075196
64075197
64011192
00008417
64086444
64044426
64044427
00049342
41538858
41538859
41538860
41538861
41538862
41538863
41538864
41538865
41538866
41538867
41538868
41538869
40085139
40085206
40085218
40095036
20932384
64093933

64109439

64109441

64109442

64109461

64109463

64109464

64109473

64109475

64109563
64141184
64059340
64059343
64059347
64059349
64059350
64059352
64059353
64059355
64059356
64059357
64098677
64098678
64206258
64206259
64237590
64109467
64109468

64109422
64098667
64098680
64098681
64075684
64105772
64057054
64040166
64040203
64040204
64040205
64040206
64214492
64109483
64067334
64011221
64011223
64011225
64011229
| 次ページ |
