HOME > 写真 > 自然・風景 > 宇宙 > 地球
10,000件の写真素材が検索されました。
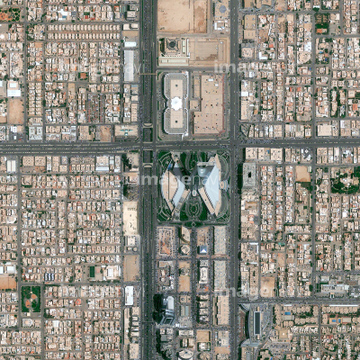
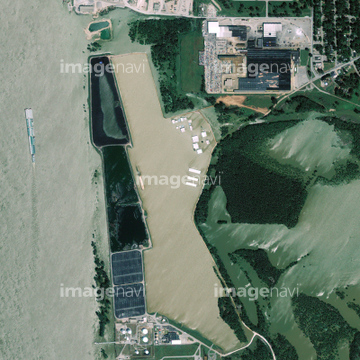
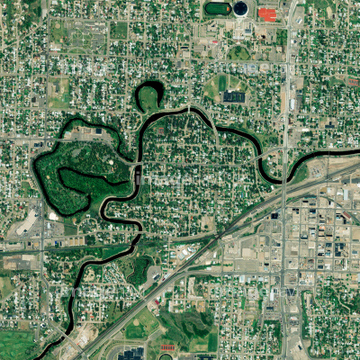
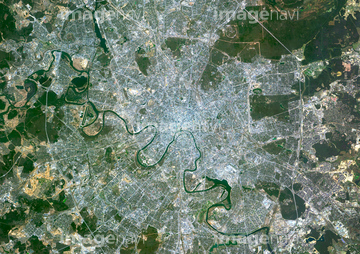
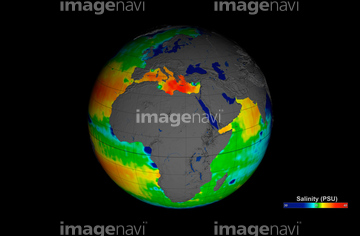
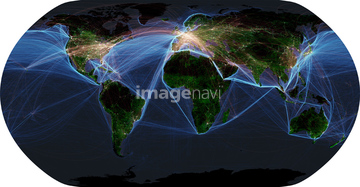
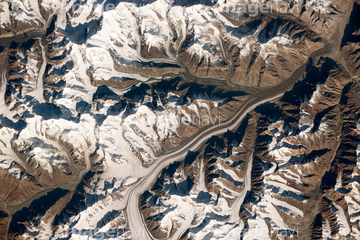
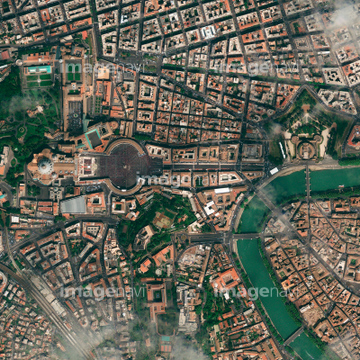
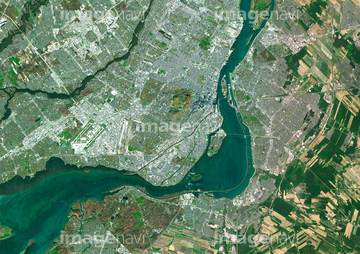
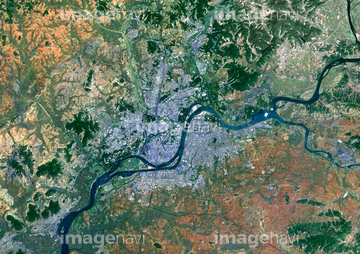
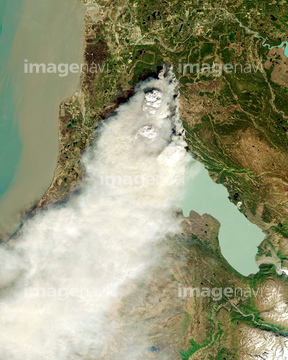
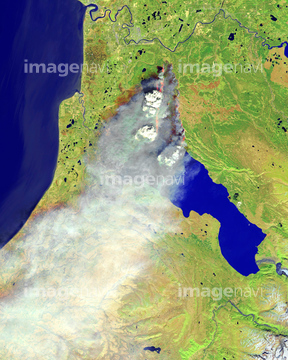
この検索結果には、Bismarck, USA, satellite image、Tornado damage, Harrisburg, USA、General DeWitt Spain Airport, USA、Minot flooding, USA, satellite image、Paris, France, satellite image、Naples, Italy, satellite imageなどが含まれています。

64109441

64109442

64109463

64109464

64109443

64109465
64053700

64109527

64109558
64109433
64109438
64109444
64109460

64109439

64109440

64109461

64109462

64109473

64109475
64119316
64109466
64109469

64109509
64098666
64045644
64141184
64059349
64059350
64059353
64262469
64109476
64086419
64109562
64059340
64059343
64059347
64059352
64059355
64059356
64059357
64072059
64072060
64098673
64098684
64098688
64098690
64098696
64098702

64041230
64045640
64045641
64045643
64045653
64045654
64045655
64075082
64091493
64131456
64168478
64097616
64089705
64109471
64141170
64040181
64109503
64097610
64085875
64059714
64058622
64045642
64050815
64050818
64050820
64050839
64050842
64050843
64053318
64053596
64053599
64072651
64072652

64109563
64218100
64203337
64098677
64098678
64059348
64078001
64078002
64078003
64078004
64078005
64075891
64059362
64059363
64098667
64098680
64098681
64057573
64057615
64109501
64109470

64109505
64141171
64093933
64086667
64073664
64073665
64011221
64011223
64011225
64011229
64047888
64041384
64041392
64041895
64011192
64045794
64075188
64075189
64075190
64075191
64075196
64075197
64086385
64086389
64086398
64086428
64086495
64086685
64044741
64109508
64131366
64131457
64057616
64149307
| 次ページ |
