HOME > 写真 > イラスト・CG > ビジネス > ビジネスイメージ
10,000件の写真素材が検索されました。
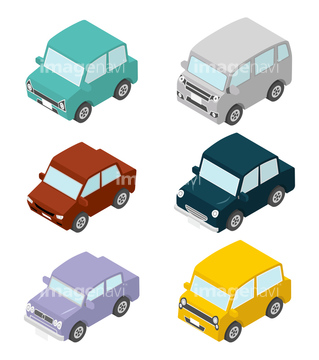
この検索結果には、グラデーションタイマー グレースケールのチャート 色調、車のアイコンセット 6種類 アイソメトリック、数種類のグラフが載った書類 アイソメトリッ、チャートグラフ アイソメトリック 、グラデーションタイマー カラフルなチャート 色調、割合が10%から90%までの円グラフのイラストなどが含まれています。
40629088
31703360
17216212
17216213
17216238
64239174
64239356

18351490
41459581
41577735
41577737
31703361
31508389
51417003
40628497
14402977
14403866
64124750
10112047
10122755
10122961
64164328
64165808
64171036
64174696
10112048
10112049
10112050
10112054
51416744
70114686
64056344
64238736
14403881
14403861
30408498

41577728

41577753
40629060
40629078
40629085
40534993
40304853
40304854
40304855
40304856
40304857
40304858
40304859
40304860
40304861
40304862
40304863
40304864
40304865
40304866
40304867
40304868
40304870
40304871
40304872
40304873
40304874
40304875
40304877
40304878
40304886
40304887
40304902
40304903
40304904
40304905
40304907
40304908
40304909
40304916
40304917
40304918
40304919
40304940
40304941
40304951
64039573
64039575
64039576
64039577
41462441
70102702
| 次ページ |
