HOME > 写真 > イラスト・CG > ビジネス > ビジネスイメージ
10,000件の写真素材が検索されました。
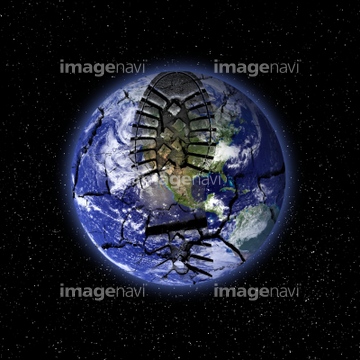
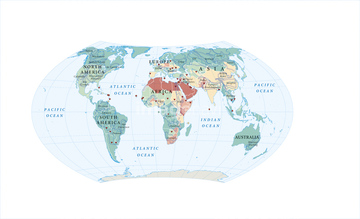
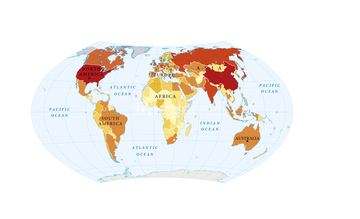
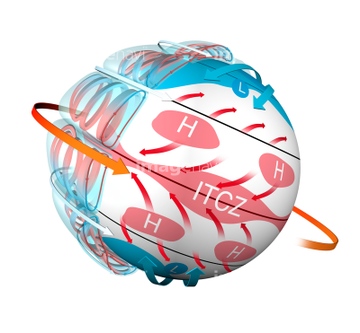
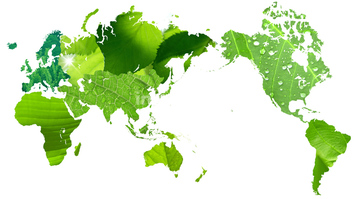
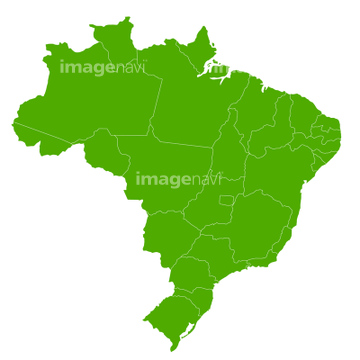
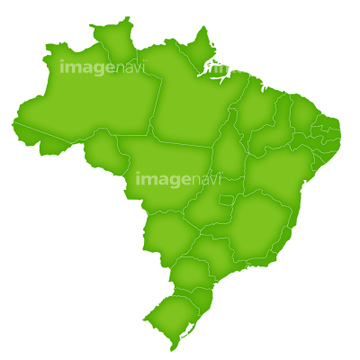
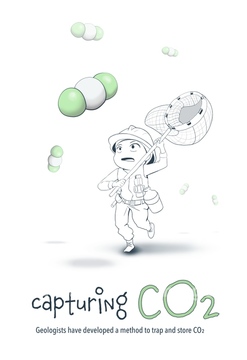
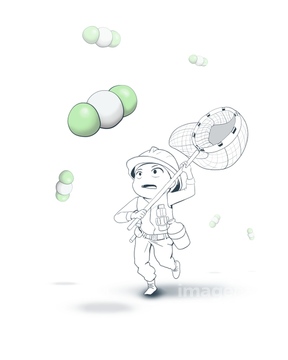
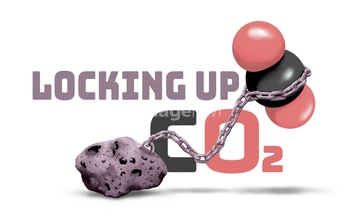
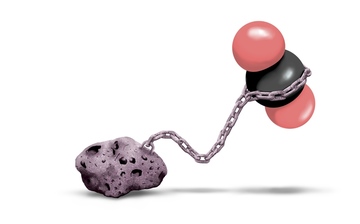
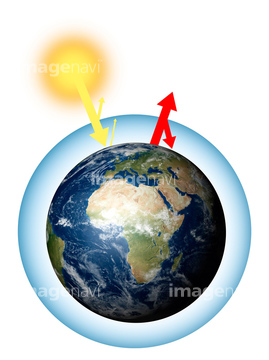
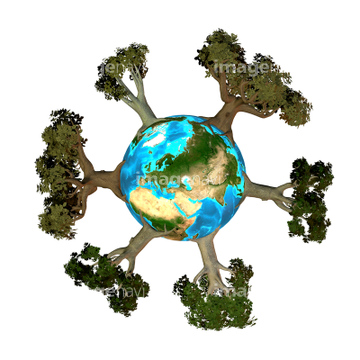
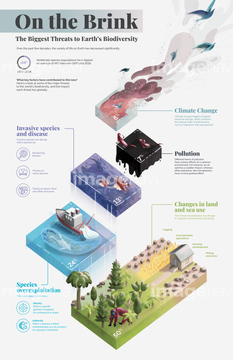
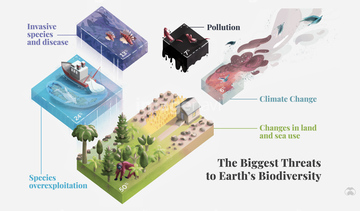
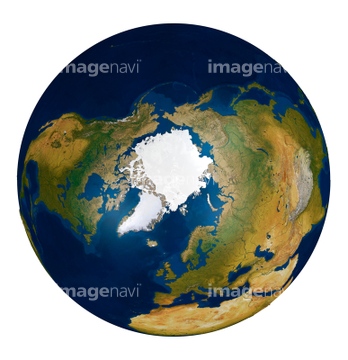
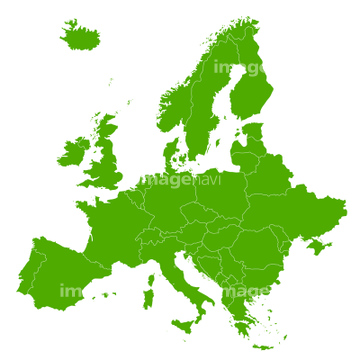
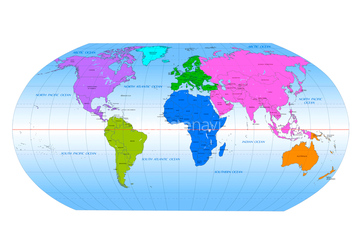
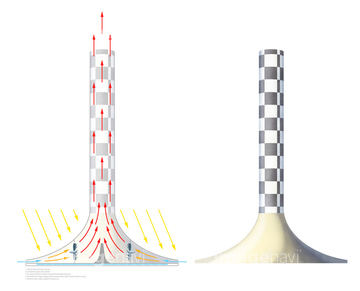
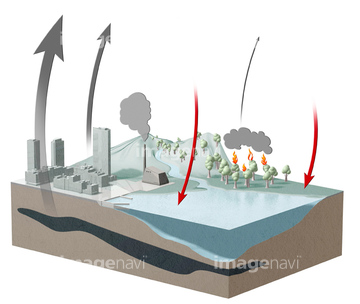
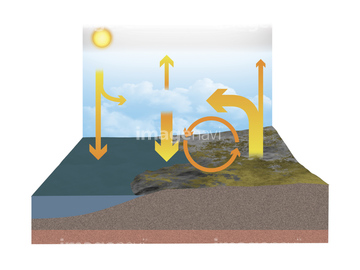
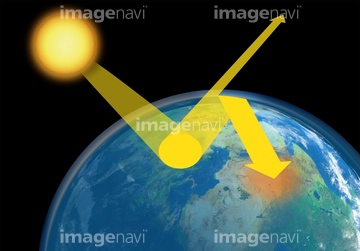
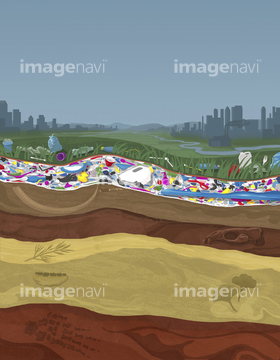
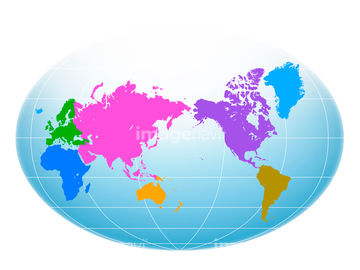
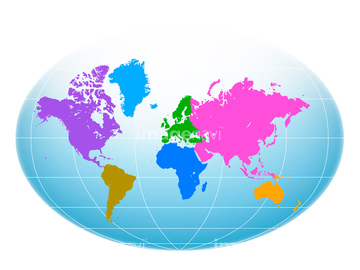
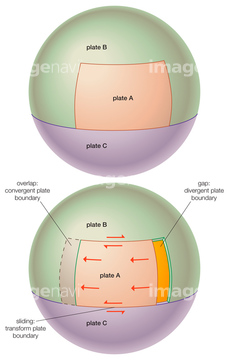
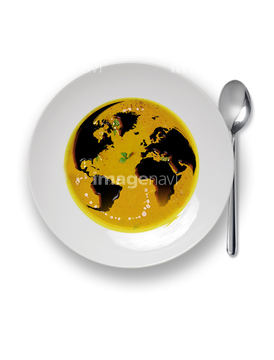
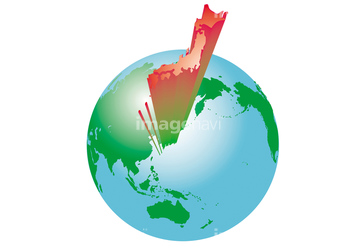
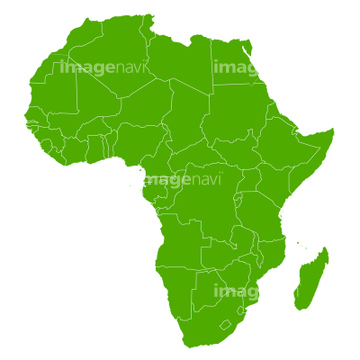
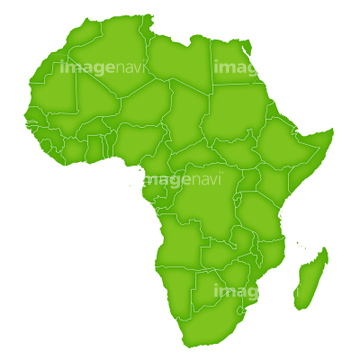
この検索結果には、葉っぱの世界地図、イラスト歳時記、ブラジル 地図 緑 アイコン 、Capturing carbon dioxide, conceptual illustration、Locking carbon dioxide in rocks, conceptual illust…、How the Earth is heated, illustrationなどが含まれています。


64043146
64100255

17234962
17234963
64239174
64239356
64100240
40027148

17207337
17207338
14401215
51416812
40583444
40583445
64263462

64261920
64040805
40629060
40629078
40629085

18351490
64078177
17234933
64053495
20571413
20571414
64113443
40583446
40583447

40583448
40583449
40583450
40583451
40583452
40583453
40552900

40552901
51416811
64088155
51416744
10112047
64116415
64084130
64263461

17269462
64179809
64168977
10112048
10112049
10112050
10112054

20530878
64168213
30408498
64084470
14403861
31592453
31592456
17216212
17216213
17216238

30081823
31508389
64091367
41577735
41577737
64189640
64189641

70114737
51416920
51417003
64029644

17227148
41575362
35726208
35726209
35726210
64042319
20541951
29041647
64090305
70093221
40582410
40582411
40582412
40582413
40582414
40582415
40582418
40582421
40585538
40585539
40585540

40585541
40585542
40585543
40585544

40585545
40585546
40585547
40585548
40585549
40585550
40585551
40585552
40585553
40585554
40585555
40585556
40585557
40585876
| 次ページ |
