HOME > 写真 > イラスト・CG > CG > 合成写真
10,000件の写真素材が検索されました。
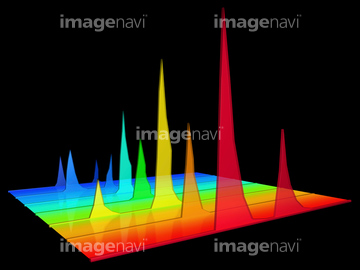
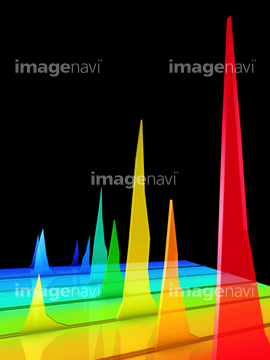
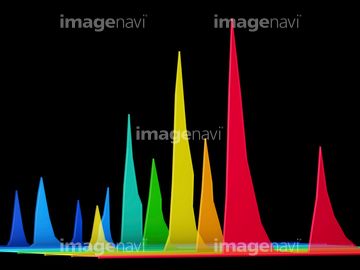
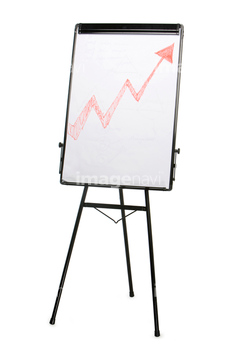
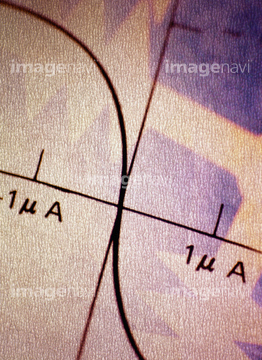
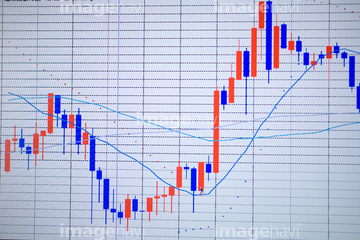
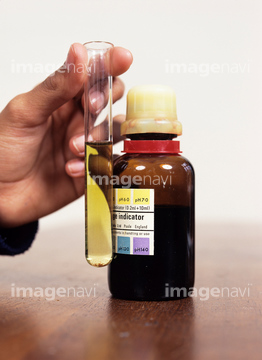
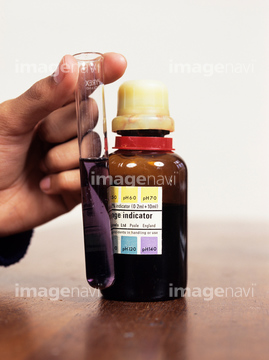
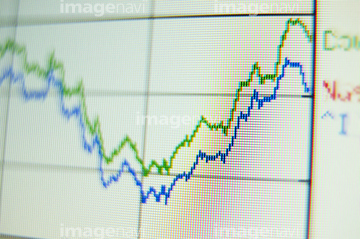
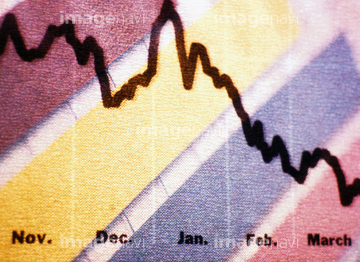
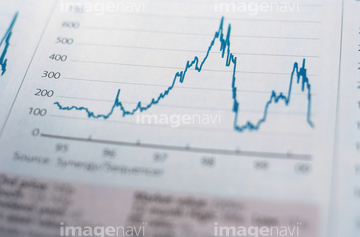
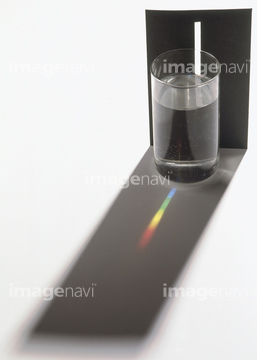
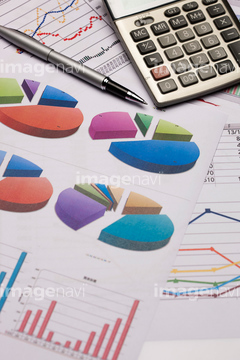
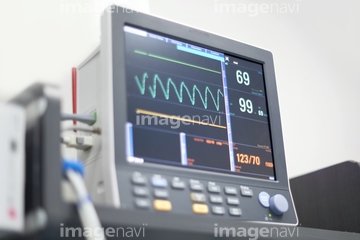
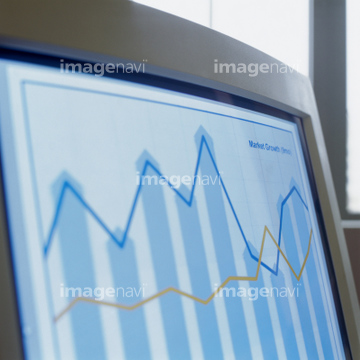
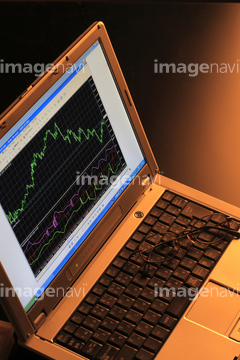
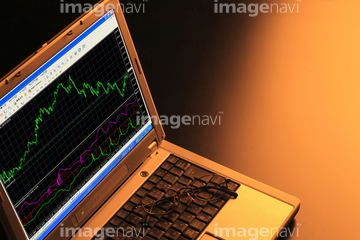
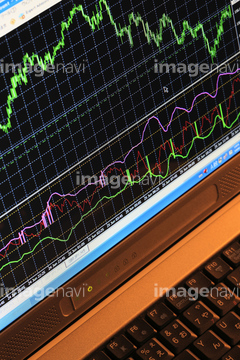
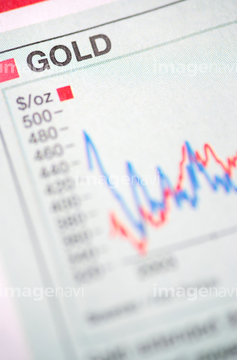
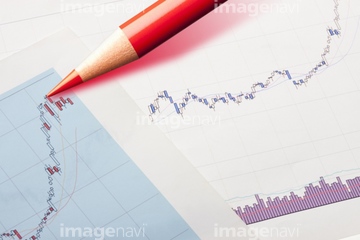
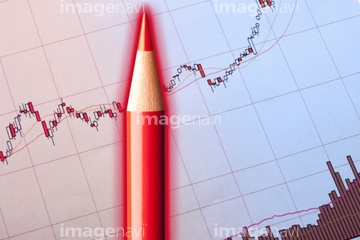
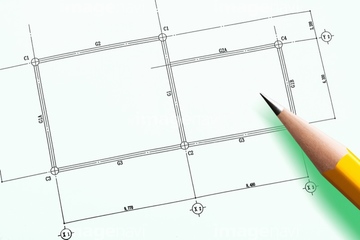
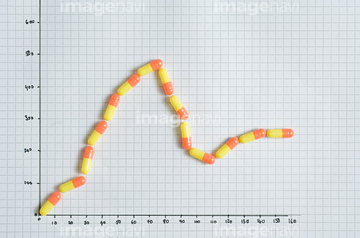
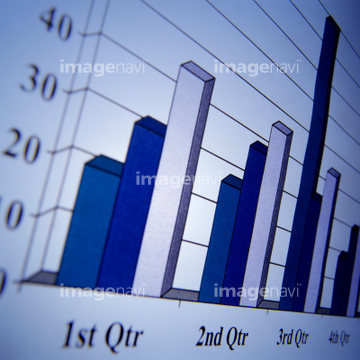
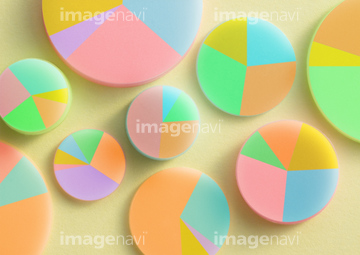
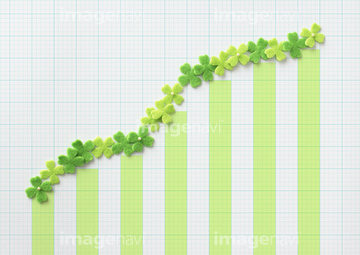
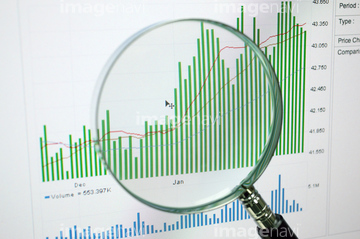
この検索結果には、チャート、株式チャート、光、医療イメージ、グラフを描いているペン、カラフルな円グラフなどが含まれています。
99055121
99055119
99055120
99055122
00001016
64000770
10917544
30022134
99033173
99033174

30022176
30022180
17275820
00001017
10307713
30022139
40061299
10917538
64037731
17205240
17205241
17205242
18107470
30013089
30013094
30022133
16921273
16921275
64011660
64028630
30022160
30381441
10975944
10137165
64039203
30022207
30022152

00052208
10123730
64000875
64000876
30022219
17225766
10918619
30310126
30022188
30022309
64229701
41473238
41473239
41473240
41473241
99033170
99033171
99033172
17246287

17246313

17246314
17246315
41058592
41058593
41058594
17211231
17211232
17211234
14956026
16936020
52210897
52210904
17264606
30060261
30022198
30038419
30338862
52210909
32492759
32444074
32444090
30453726

30338871

00052212
66000052
17235589
30022142
30022149
52209757
40061295
40061296
40061297
40061298
40061300
64037560
64000228
64000229
32492758
70283237
64008301
64009482
70282723
30022214
30028966
64242507
41058595
41058596
41058597
41058598
41058599
41058600
41058994
41058995
41058996
41058997
41058998
41058999
41059000
41059001
41059002
41059003
41059004
41059005

17235919
17235920
11611484
11611485
11611486
11611487
17266451
17266452
17266453
17266454

30430599
52214532
52214533
30351037
30028378
10918132
10918165
40842507
40842508
40842509
40842510
40842511
40842512
20930943
64038019
64038024
00048118
00048119
00048120
10917620
64008311
30013091
30045467
40848409
17211235
17211236
17211237
17211238
64008299
64008300

40836230
30022218
16921281

14902831
17227182
99055150
99055151
30013970
00052207
00052213
30086380
10918133
10918364
31724824
30423109
30423110
| 次ページ |
