HOME > 写真 > 地図・衛星写真 > 衛星写真 > 災害・気象現象
10,000件の写真素材が検索されました。
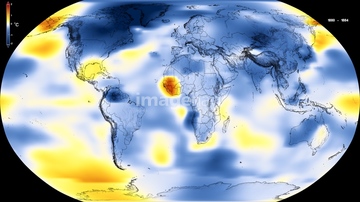
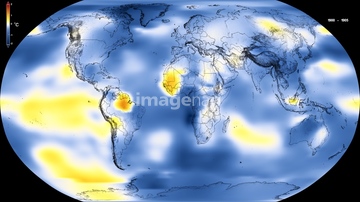
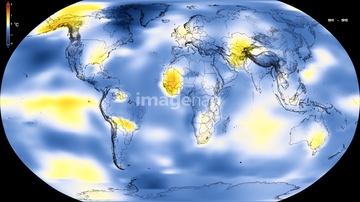
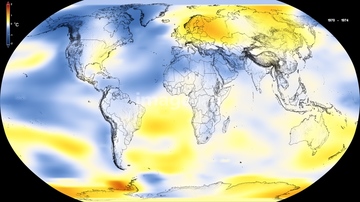
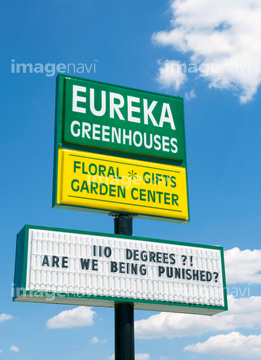
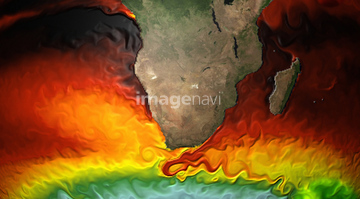
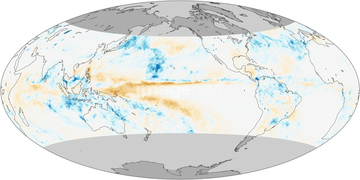
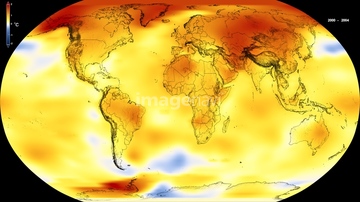
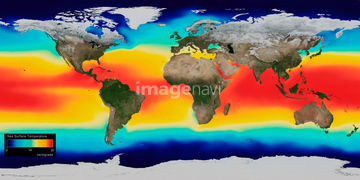
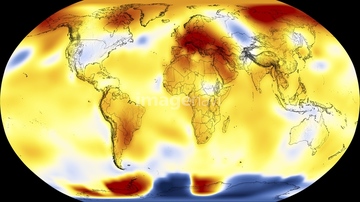
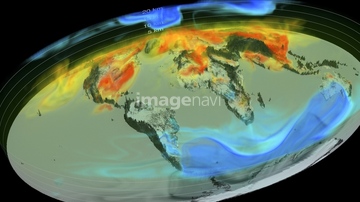
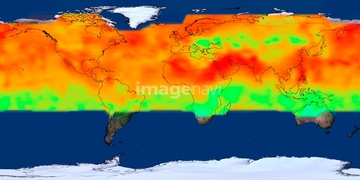
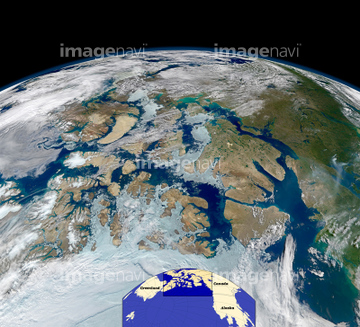
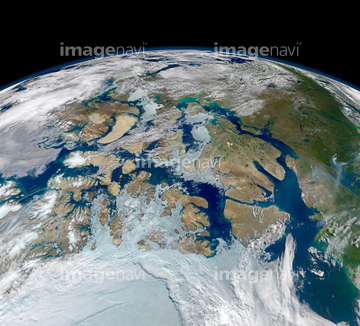
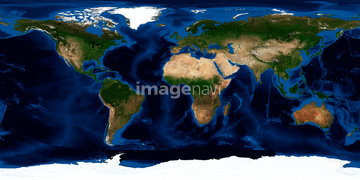
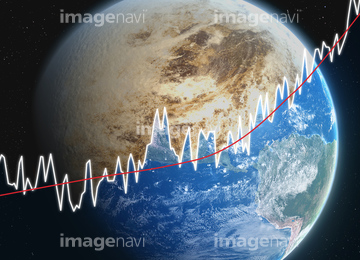
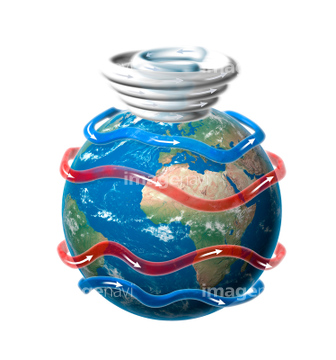
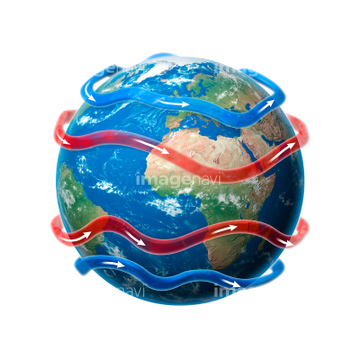
この検索結果には、Heatwave, USA、Sea surface temperature, computer model、La Nina, December 2010、Global warming record, 2000-2004、Global warming record, 2014-2018、Australian heatwave, 2022などが含まれています。
64046247
64014421
64215904
64041383
64014771

64041390
64178179

64041230
64044741
64185232
64185233
64185234
64185238
64185239
64185240
64185236
64185242
64014120
64200497
64260979
64204970
64091478
64014773

64106283
64161003
64141450
64162892
64088450
64165236
64185235
64185237
64093948
64168420
64011298
64011299
64047888
64185241
64185243
64257529
53112888
53112889
53112890
53112891
64014573
64011300
64058127
64058128
64058129
64058131
64058132
64058133
64058134
64058135
64058136

64058137
64058138
64058139
64058140
64058141
64058142
64058143
64058144
64058145
64112895
64058420
64058421
64264209

64109563
64058130
64014670
64087823
64170956
64045640
64045641
64045653
64045654
64045655
64116359
64116360
20506144
64014575
64125454
64091482
64218100

64109527

64109558
64062174
64062175
64120931
64113454

64109422

64109439

64109440

64109441

64109442

64109461

64109462

64109463

64109464

64109473

64109475
64126011
64192341
64088728
64242042
64043083

31799829
64047887
64058146
64045846

64011303

64011305

64011306
64062426
64062428
64264125
64256538

64215778
64116457
64116458
64116186
64116187
64116188
64096065
64158829
64158830
64113622
64113626
| 次ページ |
