HOME > 写真 > 地図・衛星写真 > 衛星写真 > 災害・気象現象
10,000件の写真素材が検索されました。
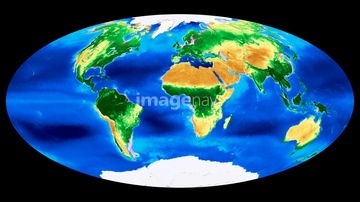
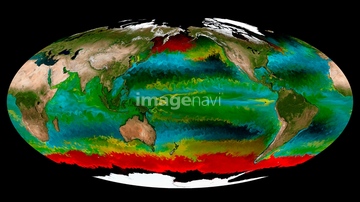
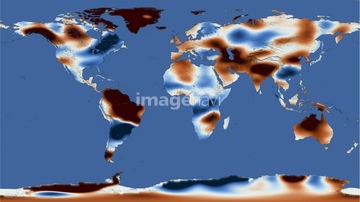
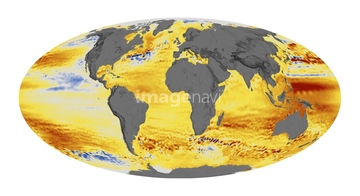
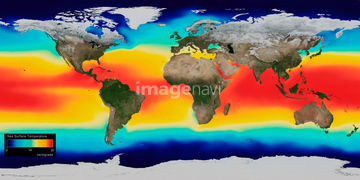
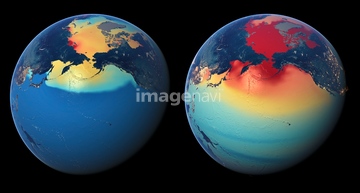
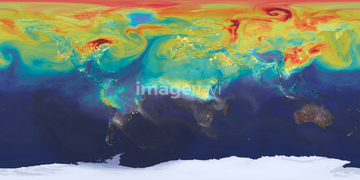
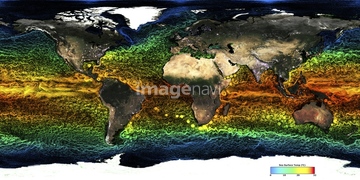
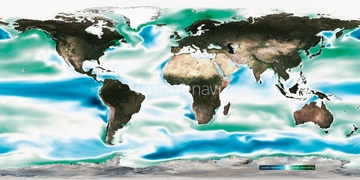
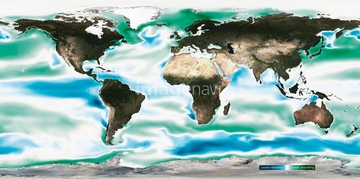
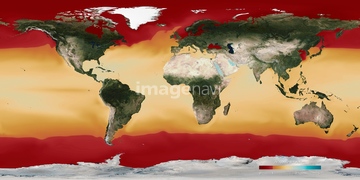
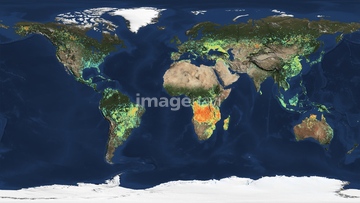
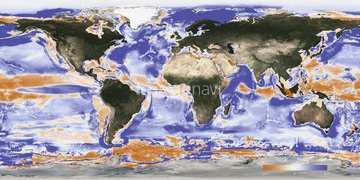
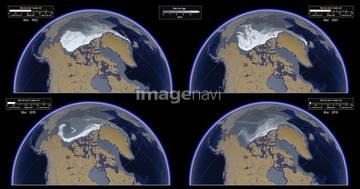
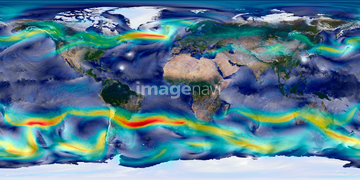
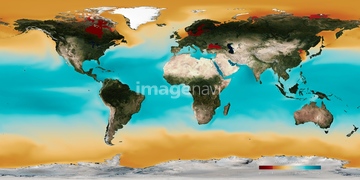
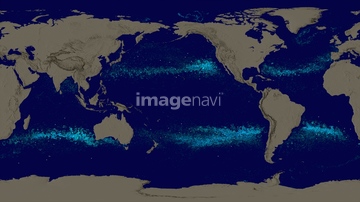
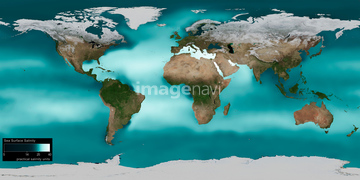
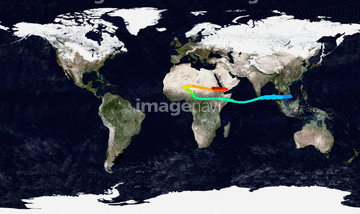
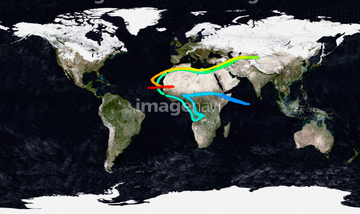
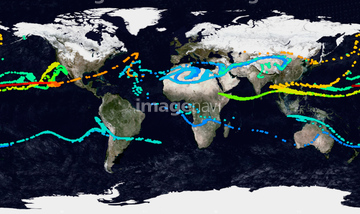
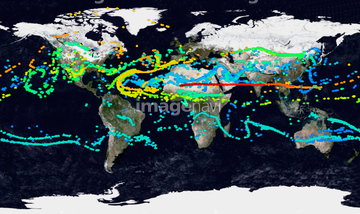
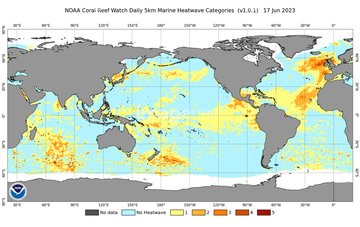
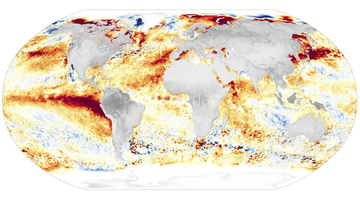
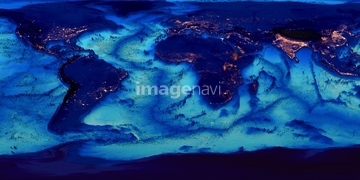
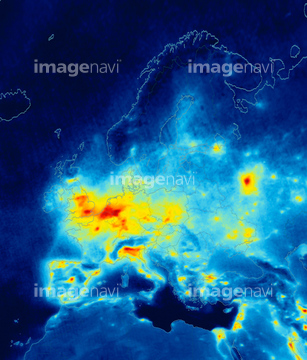
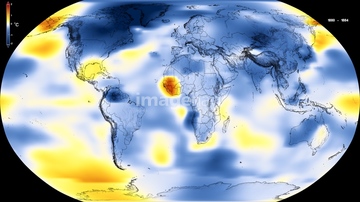
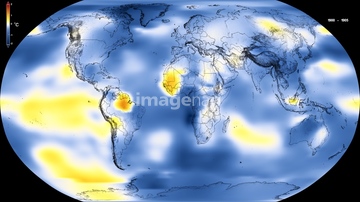
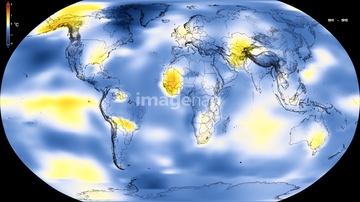
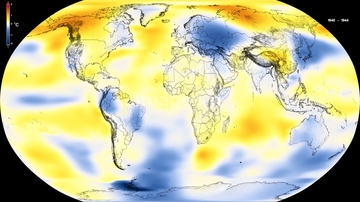
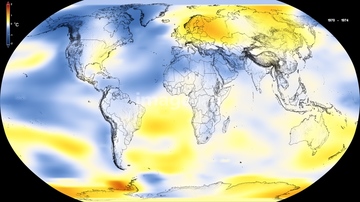
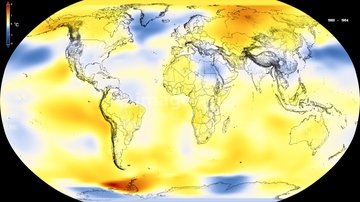
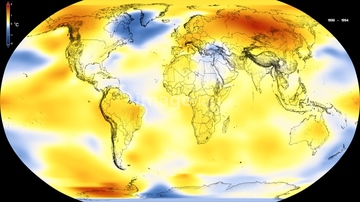
この検索結果には、Ocean surface pH, 2000、Ocean surface pH, 2030、Ocean surface pH, 2050、Ocean-atmosphere CO2 exchange, 2000、Ocean-atmosphere CO2 exchange, 2030、Ocean-atmosphere CO2 exchange, 2050などが含まれています。
64112895
64112894
64112898
64112899
64253422
64112900
64190779
64146819
64146820

64253423
64253424
64253425
64253426
64253427
64253428

64106283
64190780
64014421
64014575

64109440

64109462
64200497
64046247

64109527

64109558

64109443

64109465
64043083
64014120
64203129
64203130

64109439

64109441

64109442

64109461

64109463

64109464

64109473

64109475
64014573
64014715

64041390
64047394
64160092

64041230
64045846
64105944
64254063
64201808
64109433
64109438
64109444
64109460
64109476

64109563
64131456
64014771
64116186
64116187
64116188
64113454
20506144
64145886
64109471
17200257
64067518
64067523
64067524
64071961
64109488

64109489
64109490
64043123

64109422

64215904
64041231
64075202
64188515
64188516
64201790
64201791
64109466
64109469

64109509
64011221
64011223
64011225
64011229
64105444
64041383

64014574
64102191
64047888
64014670
64112944
64218100

64109472
64262548
64106828
64044426
64044427
64185232
64185233
64185234
64185236
64185238
64185239
64185240
64088450
| 次ページ |
