HOME > 写真 > 産業・環境問題 > エネルギー・エコロジー > 環境破壊・汚染
10,000件の写真素材が検索されました。
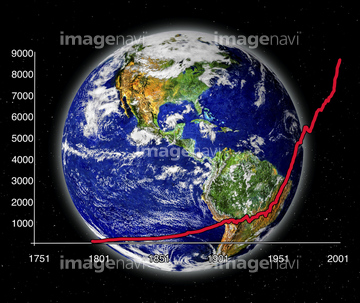
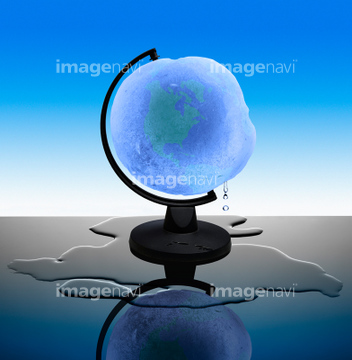
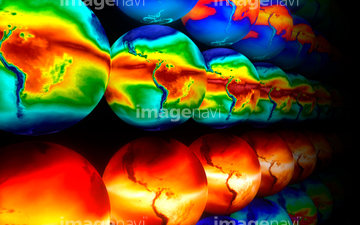
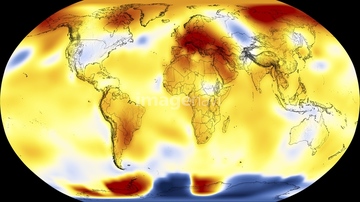
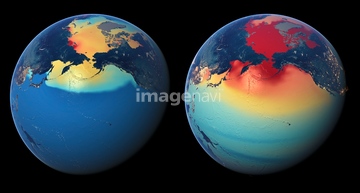
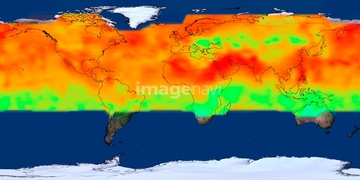
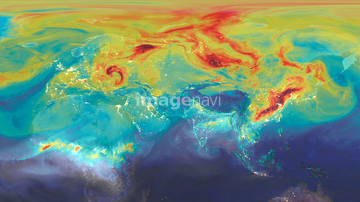
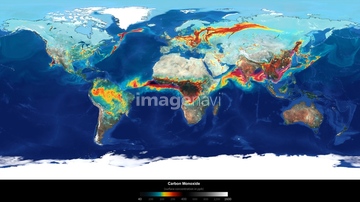
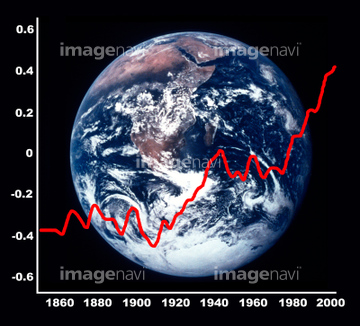
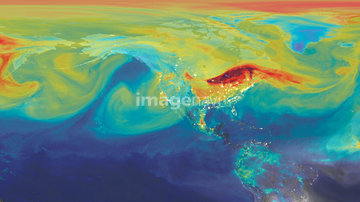
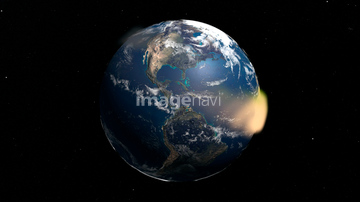
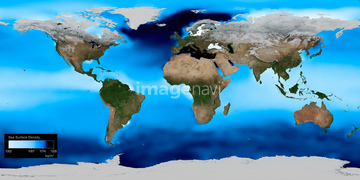
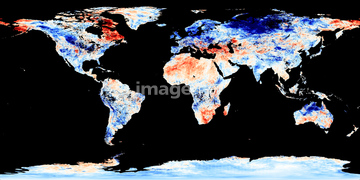
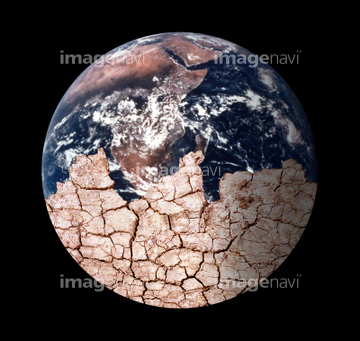
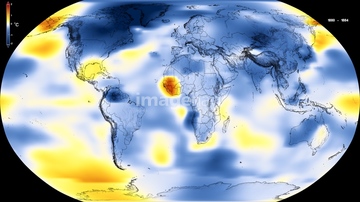
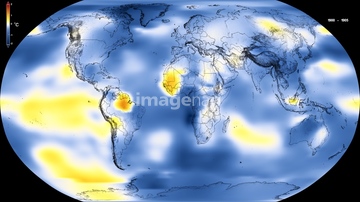
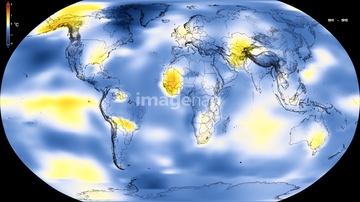
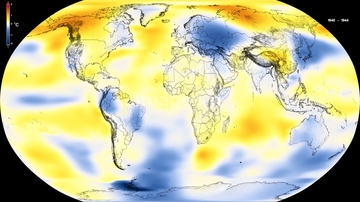
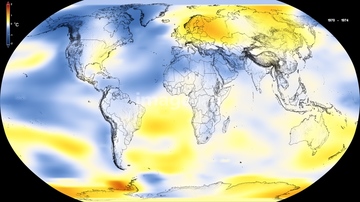
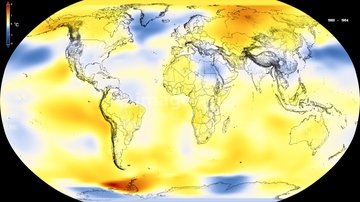
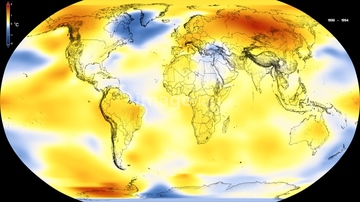
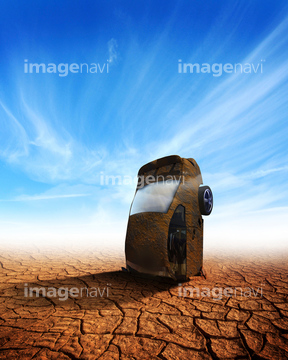
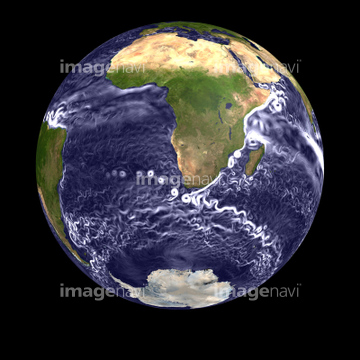
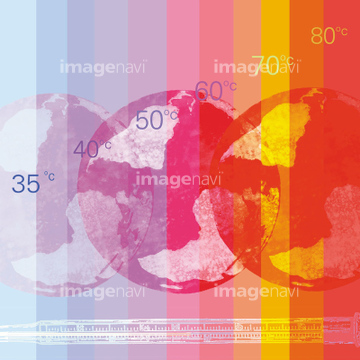
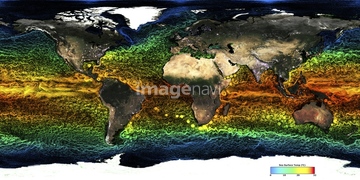
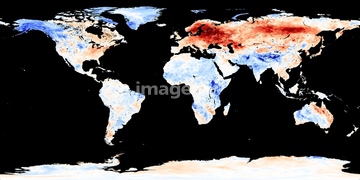
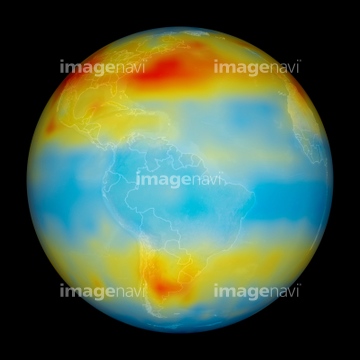
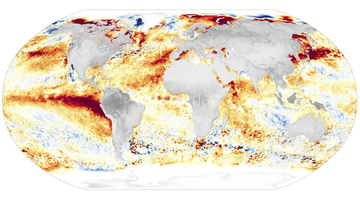
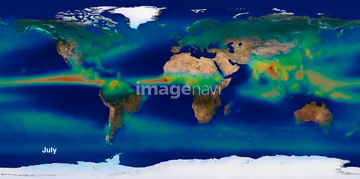
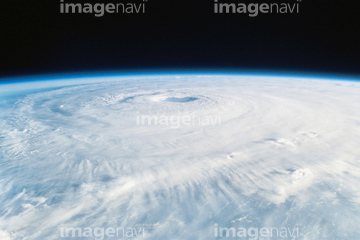
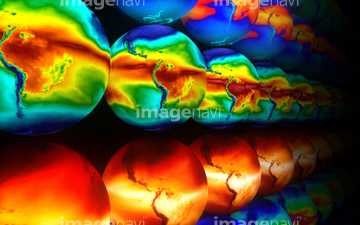
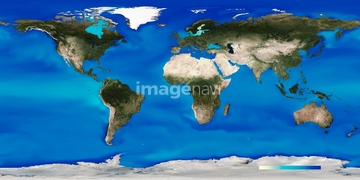
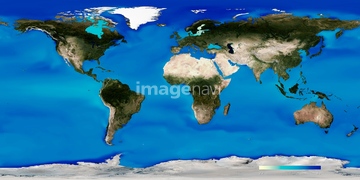
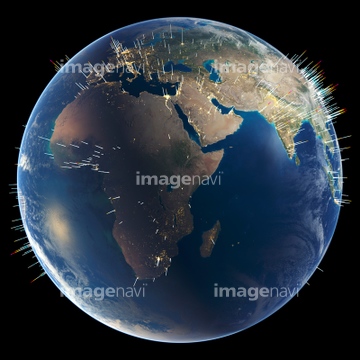
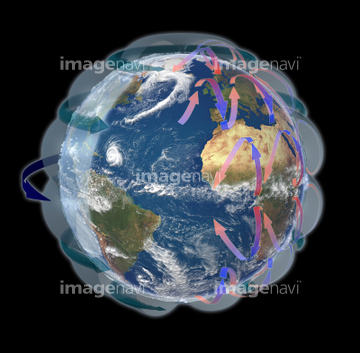
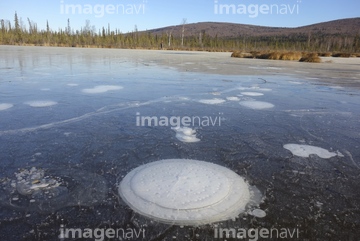
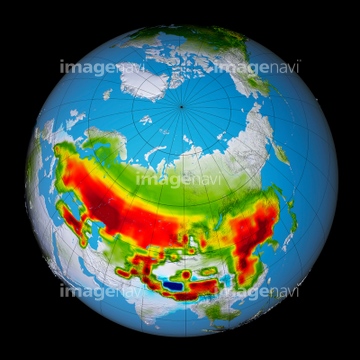
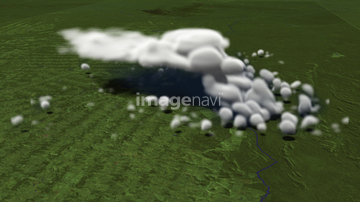
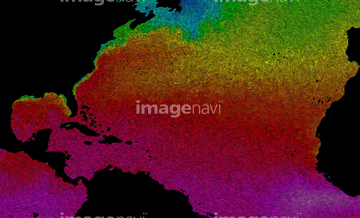
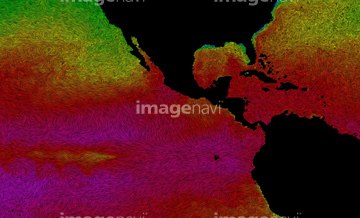
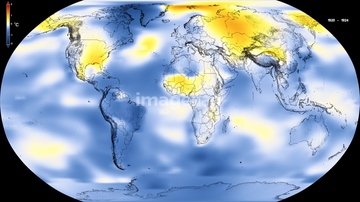
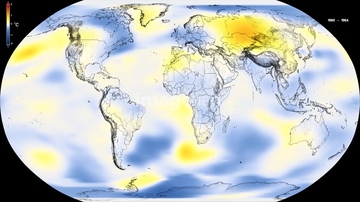
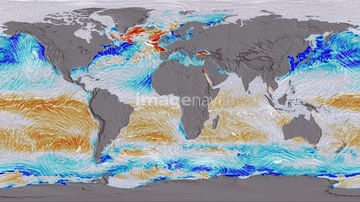
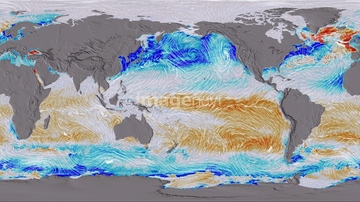
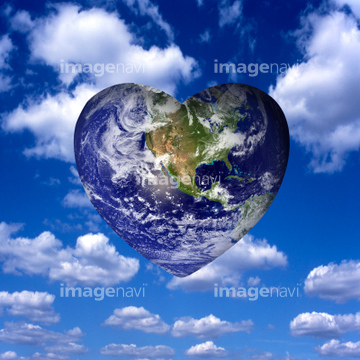
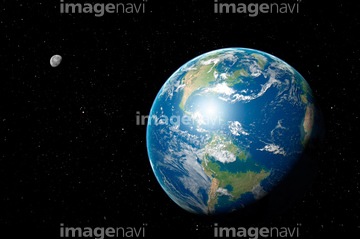
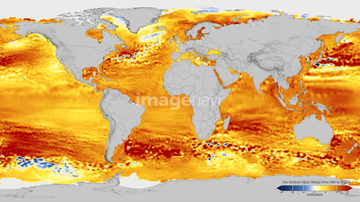
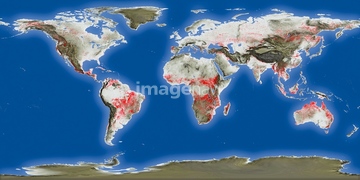
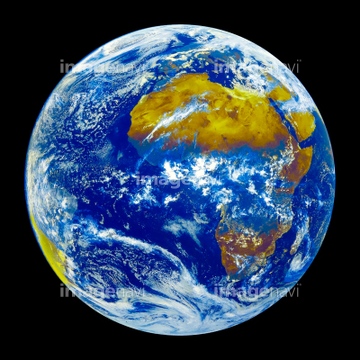
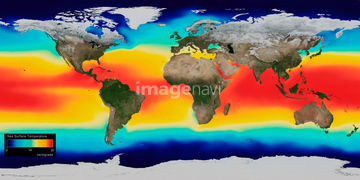
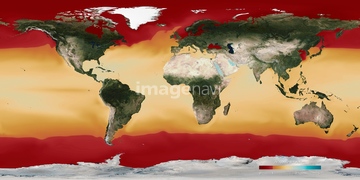
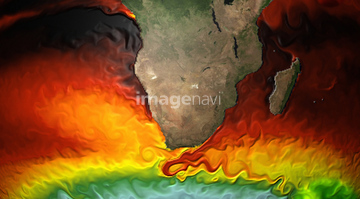
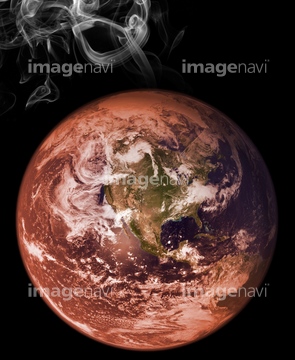
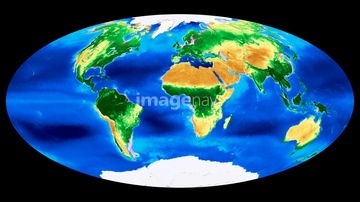
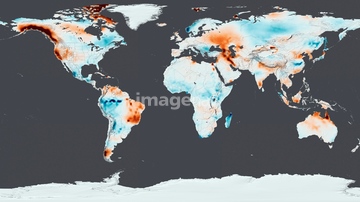
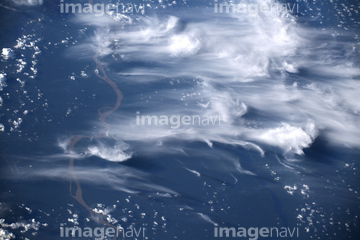
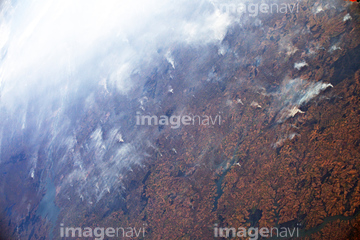
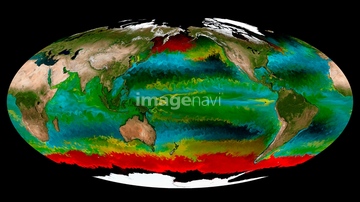
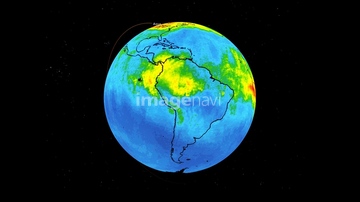
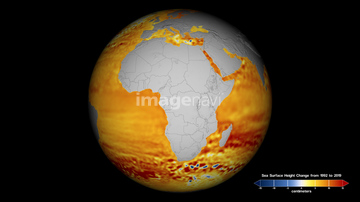
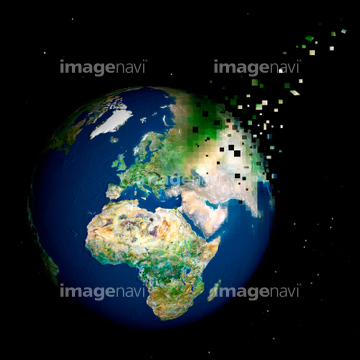
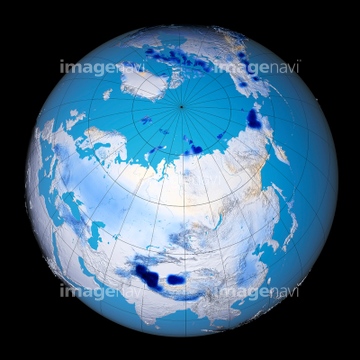
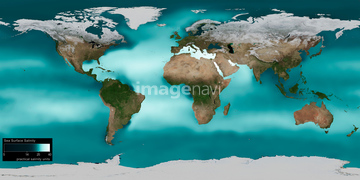
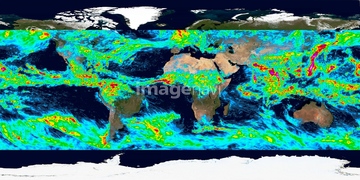
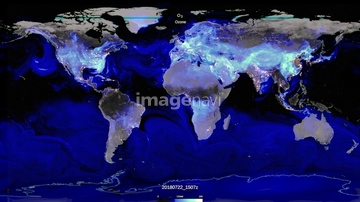
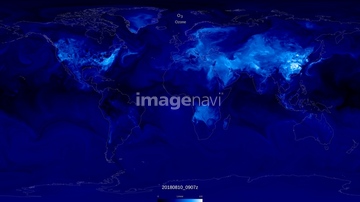
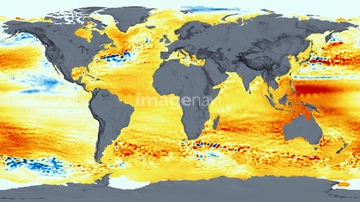
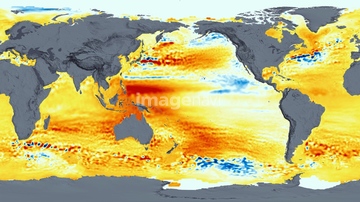
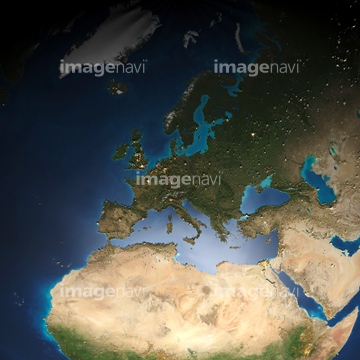
この検索結果には、Cold snap in January 2010, world map、USA carbon dioxide urban emission、Atmospheric aerosols, artwork、Sea surface density, global map、Global temperature anomalies, 2009、Global warming, conceptual artworkなどが含まれています。

64160092
64047394

64144994

64037945
64067518

64109527

64109558
64045846

64071961

64017242

64254063
64067523
64067524

64106283

64109465
64105944


64112895

64014715
20506144


64109443
64049619
64051927
64051928
64201791

64145886
64112894
64201790
64014695

64041230
64254089
64044426
64044427
64014575
64014421
64014694
64185232
64185233
64185234
64185236
64185238
64185239
64185240
64014759
64161607
17266327
64058322


64051929
64109444
64109460

64109463

64109464
64040203
64040204
30077534
64201808
64200497
64109505
64014939
64014120

64109461

64109462
64017217
64017218
64052195
20569457
64097570
64067805
64014831
64109433
64109438

64109441

64109442
64105961

64109422

64050168
64009271

64109502
64040166
64040205
64040206
64185235
64185237
64185241
64185242
64185243

64109509
64037946
64109503
10994712
64063998
64086444

64253422

64145885
64218473
64014573

64109439

64109440

64109473

64109475
64109476
29039260


64041390
64075588
64075590
64242042
64054809
64043083
64014702

64062174

64062175
64047887
53118752
64023484
20569456
17229648
17229649
64112900
64188515
64188516
64253423
64014574
64112898
64112899
64105946
64060128
| 次ページ |
