HOME > 写真 > 自然・風景 > 宇宙 > 地球
10,000件の写真素材が検索されました。
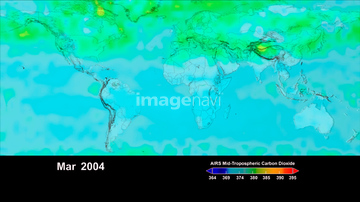
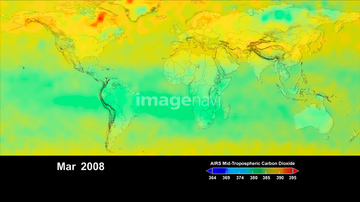
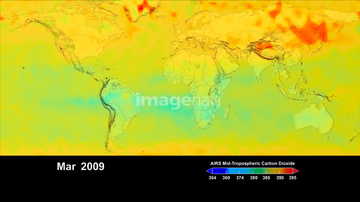
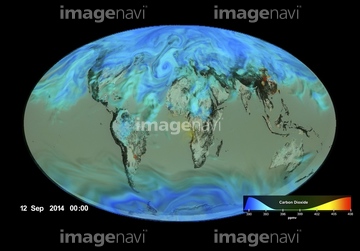
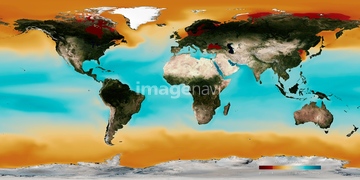
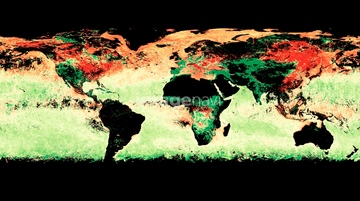
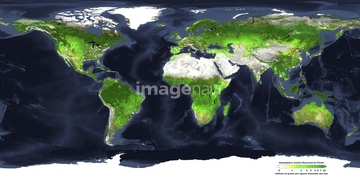
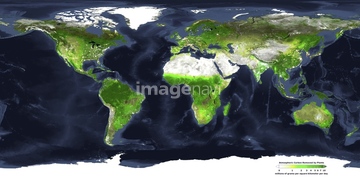
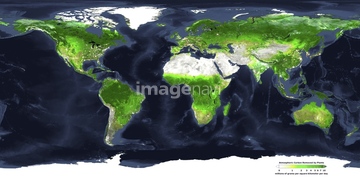
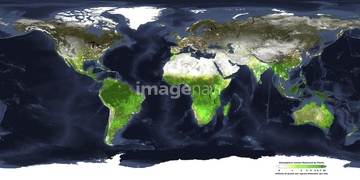
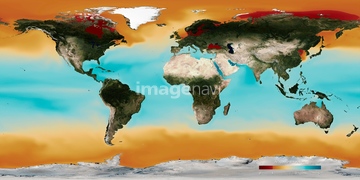
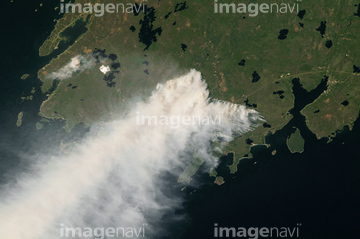
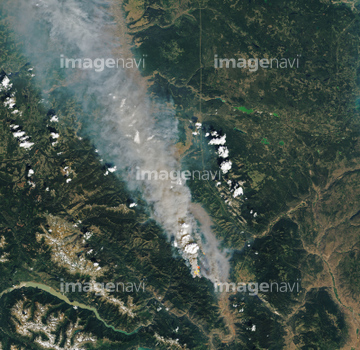
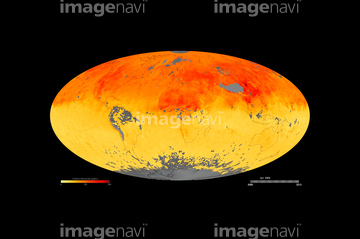
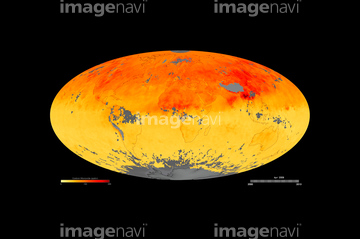
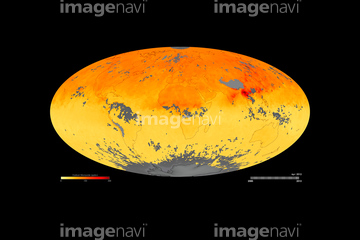
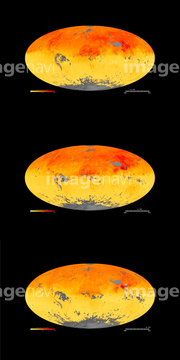
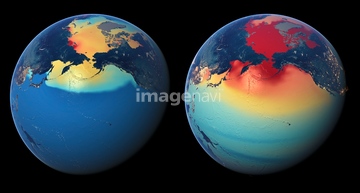
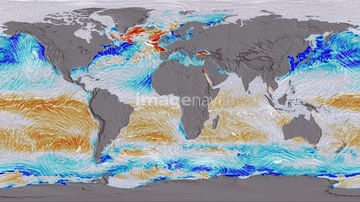
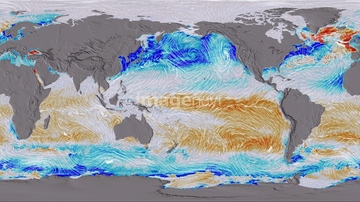
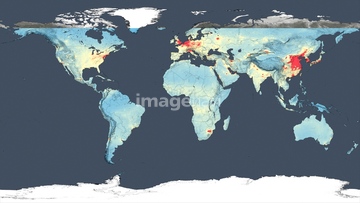
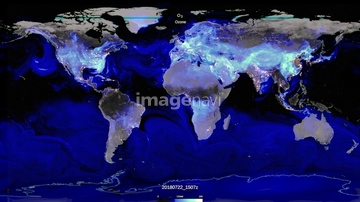
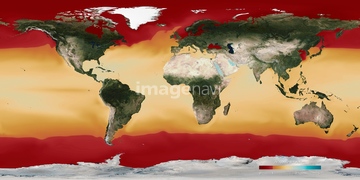
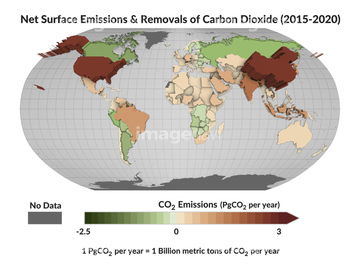
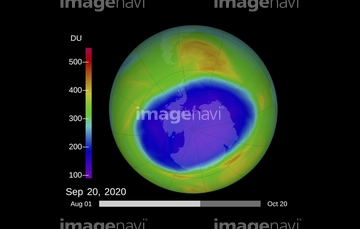
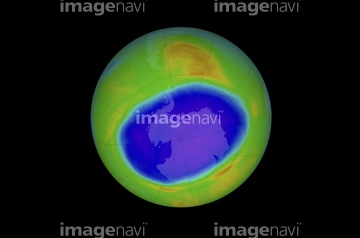
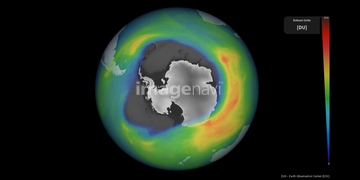
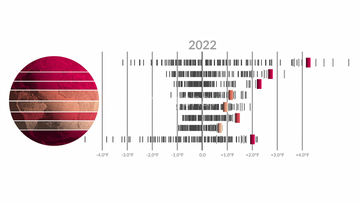
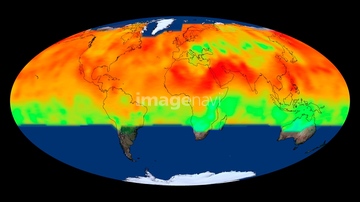
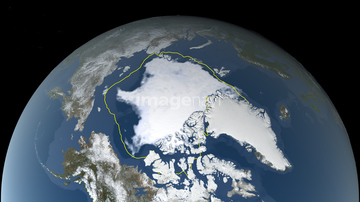
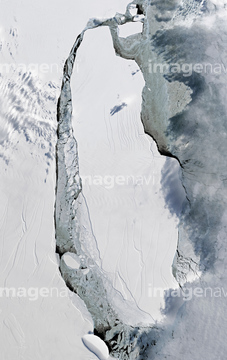
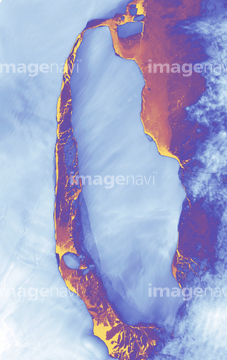
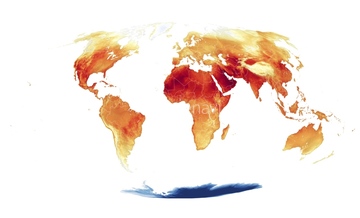
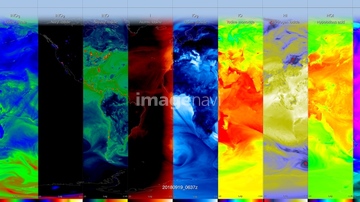
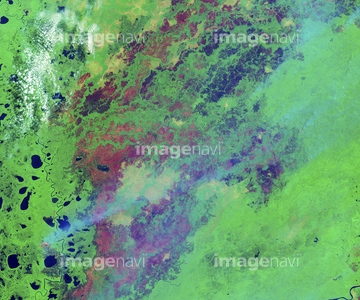
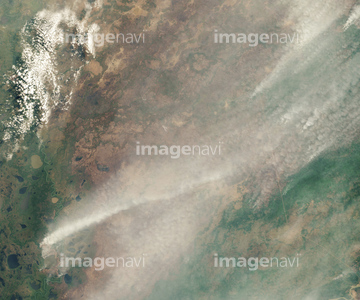
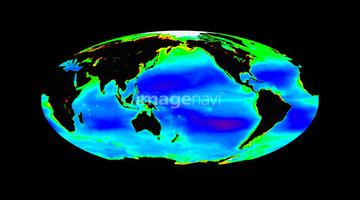
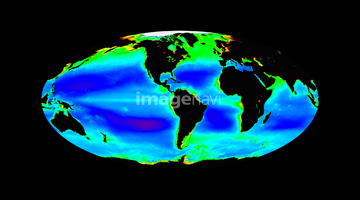
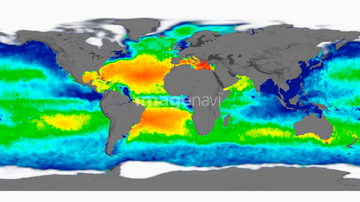
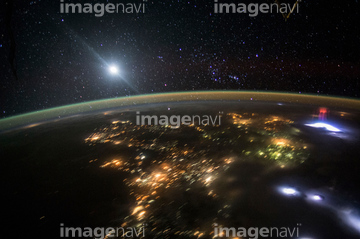
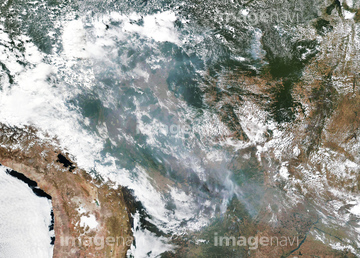
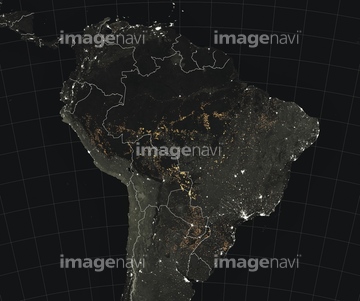
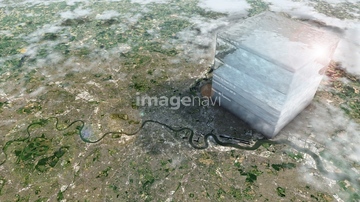
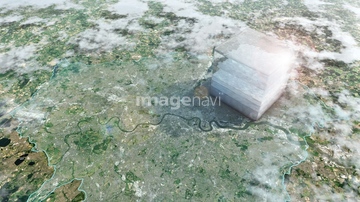
この検索結果には、Ocean surface pH, 2050、Ocean carbonate saturation, 2015、Ocean carbonate saturation, 2030、Ocean carbonate saturation, 2050、Wildfire, Nova Scotia, Canada, May 2023、British Columbia wildfire, June 2021などが含まれています。
64109502
64109503
64109505
64109421

64109461

64109462

64109463

64109464

64109444
64109460

64109465
64056070
64056071
64056072

64109439
64109470

64109422
64263237
64263238
64254063

64109509

64109527

64109558

64109472

64109440

64109441

64109442
64109471

64109473

64109475
64219634
64219636
64125447
64090803
64109501
64105944
64201791
64254089
64011192
64218100
64203337
64170956
64109433
64109438

64109443
64109466
64109469
64109476
64043836
64043838
64088450
64112895

64109563
64105772
64206258
64206259
64237590
64257903
64257904
64192700
64112894
64257411

64260136
64160092
64091492
64260979
64097601
64097602
64255140
64262470
64253216
64253217
64109508

64106283
64109506
64257529
64091461
64091462
64109483
64088667
64255396
64185241
64185242
64185243
64200590
64262469
64109467
64109468
64217602
64085879
64085880
64105949
64169502
64154867
64212738
64098663
64059717
64047394
64188515
64188516
64188517
64188518

64116185
64116457
64116458
64255401
64257399
64204970
64204971
64247623
64215904
64058420
64058421
64088702
| 次ページ |
