HOME > 写真 > 自然・風景 > 宇宙 > 地球
10,000件の写真素材が検索されました。
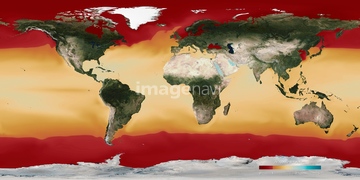
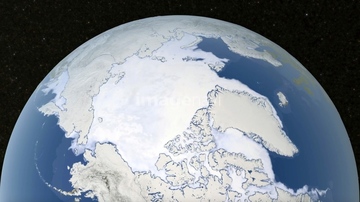
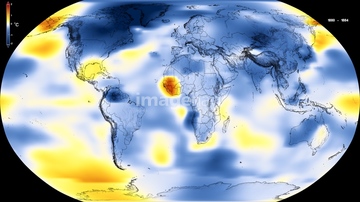
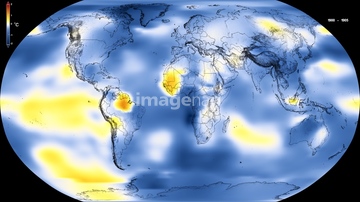
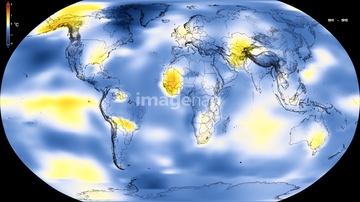
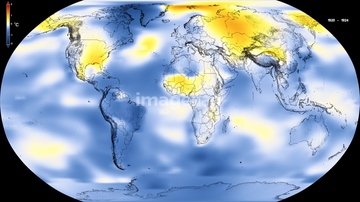
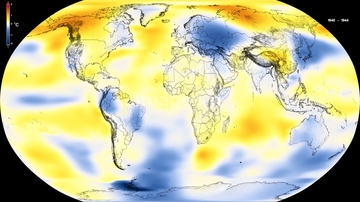
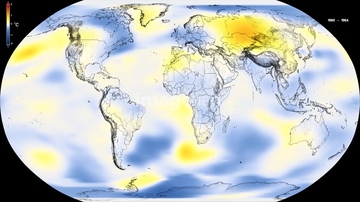
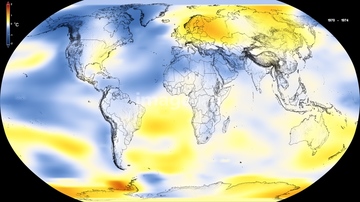
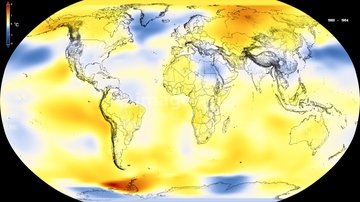
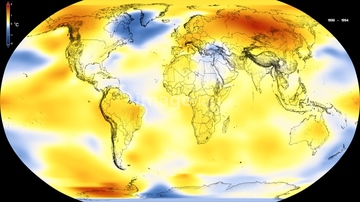
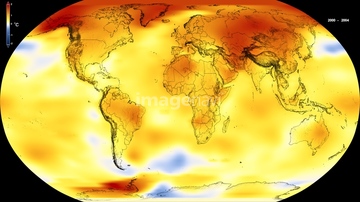
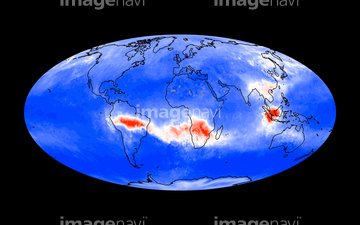
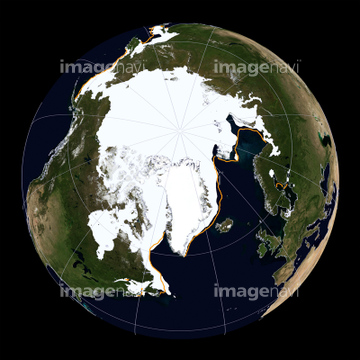
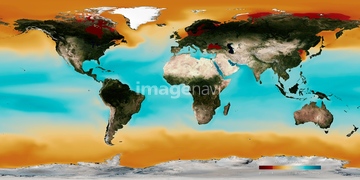
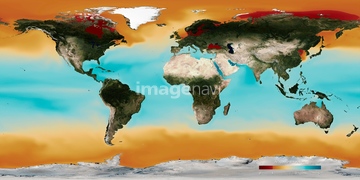
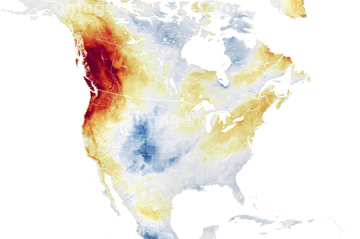
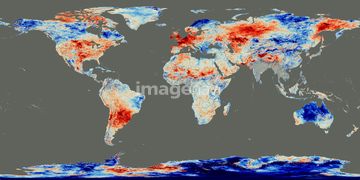
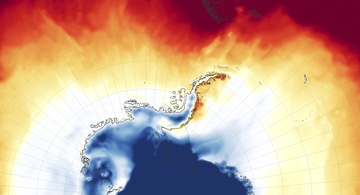
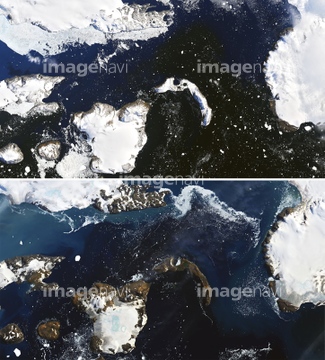
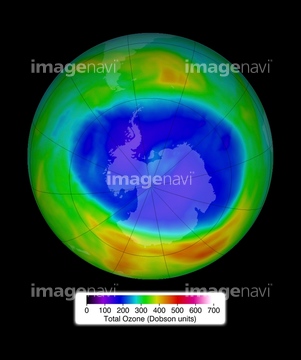
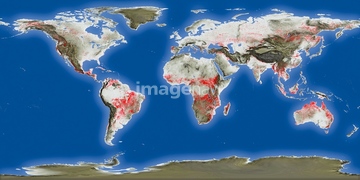
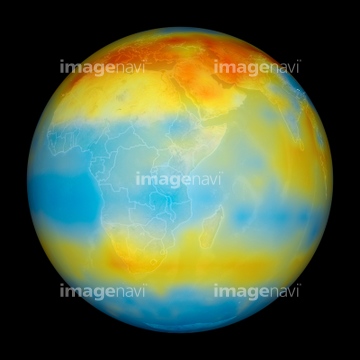
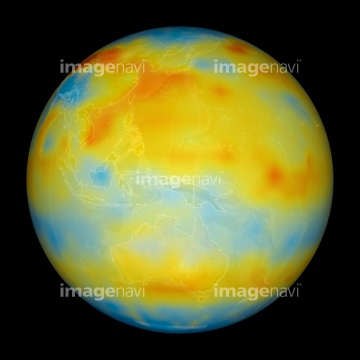
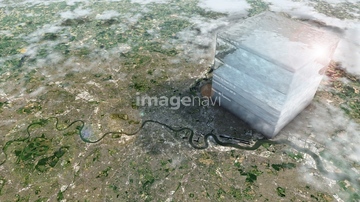
この検索結果には、Arctic sea ice maximum, March 2019、Global warming record, 1880-1884、Global warming record, 1900-1905、Global warming record, 1911-1915、Global warming record, 1920-1924、Global warming record, 1940-1944などが含まれています。
64188517
64188518
64188515
64188516
64109506
64093933
64219634
64201790
64201791

64106283
64109433
64109438

64109439

64109440

64109441

64109442

64109443
64109444
64109460

64109461

64109462

64109463

64109464

64109465
64109466
64109469

64109473

64109475
64109476

64109509

64109527

64109558

64109563
64257529
64218100
64203337
64116185
64178179
64185232
64185233
64185234
64185235
64185236
64185237
64185238
64185239
64185240
64185241

64041390
64092866
64092867
64092868
64072059
64072060
64105772
64088450
64098677
64098678


64109422
64109470
64109471

64109472
64109503
64109505
64075082
64208339
20543664
64185242
64185243
64088702

64092865
64219636
64014573
64045640
64045641
64045643
64045644
64045653
64045654
64045655
64190764

64041230
64014771
64058420
64058421
64093901
64039902
64091420
64210700
64253111
64253112
64214598
64262469
64044426
64044427
64141184
64097610
64091493
64098666
64098667
64098673
64098680
64098681
64098684
64098688
64098690
64098696
64098702
64059340
64059343
64059347
64059349
64059350
64059352
64059353
64059355
64059356
64059357
64059362
64059363
64059714
64040166
64040203
64040204
64040205
64040206
64109502

| 次ページ |
