HOME > 写真 > 地図・衛星写真 > 衛星写真 > 環境問題
10,000件の写真素材が検索されました。
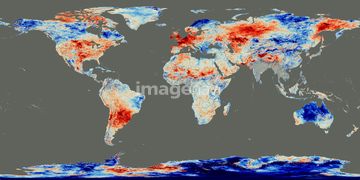
この検索結果には、MTG-S satellite and Sentinel-4 mission, illustrati…、European nitrogen dioxide emissions, 2008、Environmental awareness、Cold snap in January 2010, world map、Summer heatwave, 2006、Atmospheric aerosols, artworkなどが含まれています。
64014574
64014575
64014573

64109443

64109465
64109433
64109438

64109441

64109442
64109444
64109460

64109463

64109464
64109476
64014120
64040205
64040206

64109439

64109440

64109461

64109462
64109466
64109469

64109473

64109475

64109422
64014421
64040203
64040204

64109527

64109558
64109470
64109471

64109472
64085885
64085886
64105944
64045846
64040166

64106283

64041390
64014715

64041230
64014771
64044426
64044427
64053325
64078001
64078002
64078003
64078004
64078005
17200257
64185232
64185233
64185234
64185235
64185236
64185237
64185238
64185239
64185240
64185241
64112898
64112899
64253422
64041383
64062174
64062175
64072059
64072060
64058420
64058421
64097610
64011032
64131456


64109563
17200249
17200250
17200253
17200255
64073664
64235896
64112895
64160092
64178179
64106828
64043123
64041391
64056070
64056071
64056072
64170235
64170236
64123560
64043083
64242042
64040980
64088728
64046391
64253423
64253424
64253425
64253426
64253427
64253428
64011221
64011223
64011225
64011229
64105946
17200256
17200258
64093933
64098666
64098673
64098684
64098688
64098690
64059340
64059343
64059349
64059352
64059353
64059355
64059356
64091493
64254088
64185242
64185243
64214492
64188515
64188516
64188517
64188518
64086444
64086667
64014773
64263237
64011192
| 次ページ |
