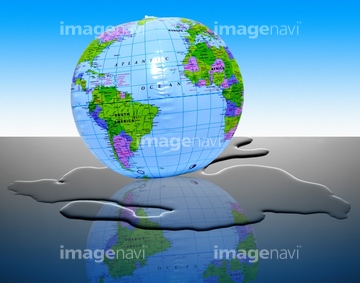
HOME > 写真 > 自然・風景 > 宇宙 > 地球
10,000件の写真素材が検索されました。
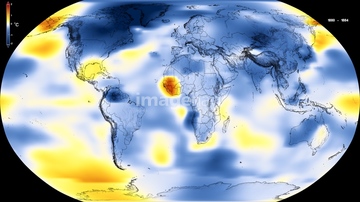
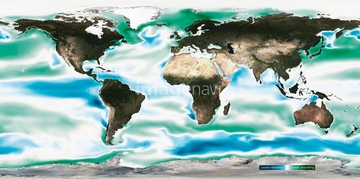
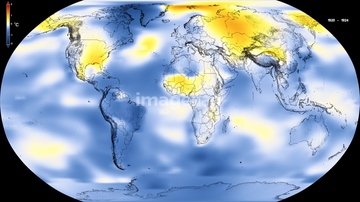
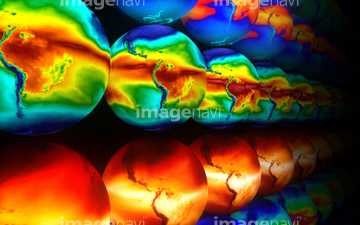
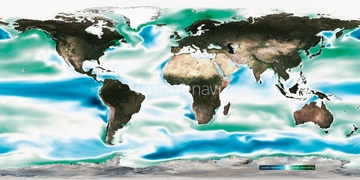
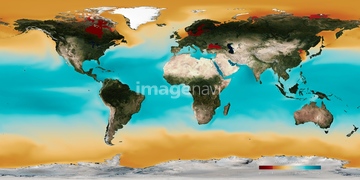
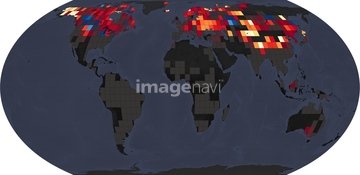
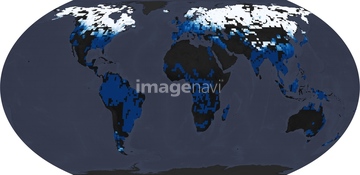
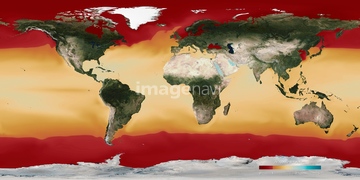
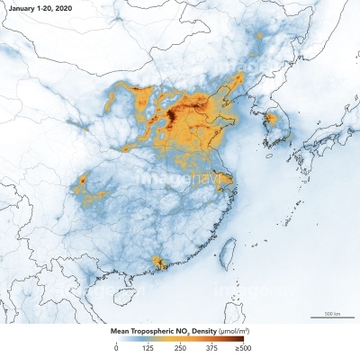
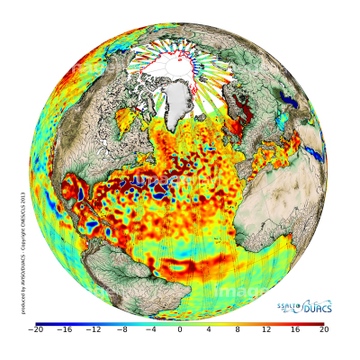
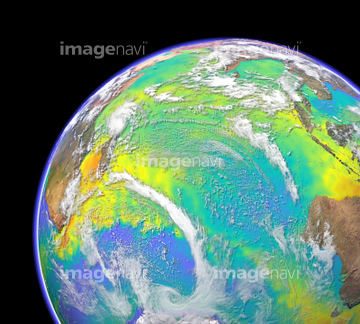
この検索結果には、Ocean surface pH, 2000、Ocean surface pH, 2015、Ocean surface pH, 2030、Ocean surface pH, 2050、Ocean-atmosphere CO2 exchange, 1861、Ocean-atmosphere CO2 exchange, 2000などが含まれています。
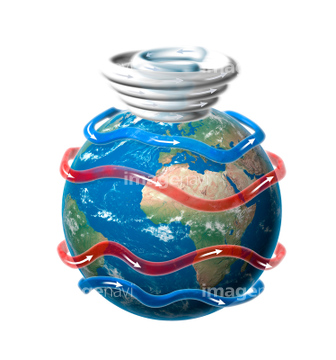
64092866
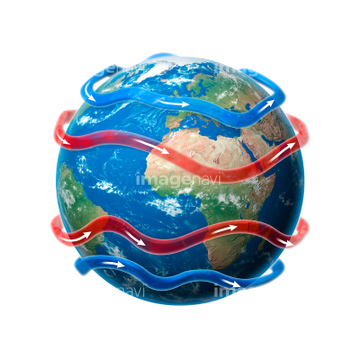
64092867
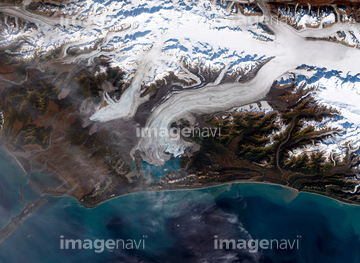
64092868

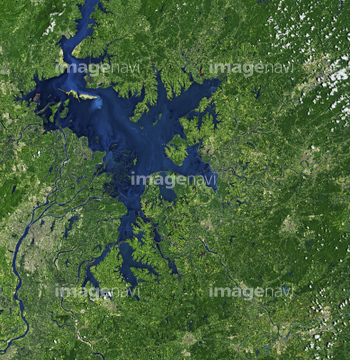
64092865
64178179
64185240
64204733
64204734

64106283
64008734
64185233
64185234
64185238
64185239
64185236
64201796
64201797
64201798
64201799
64185232

64041390
64260979
64204970
64141450
64162892
64128970
64109438
64109460

64109563
64015277
64045643
64185235
64185237
64188515
64188516
20543664
64014771
64109433

64109439

64109440

64109441

64109442
64109444

64109461

64109462

64109463

64109464

64109473

64109475

64109527

64109558
64218100
64058420
64058421
64045640
64045641
64045644
64045653
64045654
64045655

64041230
64154867
64105772
64169502
64255401
64257399
64257411
64204971
64247623
20543741
64109469
64097610
64088702
64087831
64087873
64087874

64109443

64109465
64109476
64190764
64098696
64040166
64040203
64040204
64040205
64040206
64088728
64043083
64242042
64062426
64062428
64040980
64041383
64185241
64188517
64188518
64193197
64193198
64193199
64193201
64193203
64193205
64067330
64210708
64091421
64109466

64109509
64257529
64203337
64161003
64062174
64062175
64015263
64253111
64253112
64139348
64149139
64091427
64077812
64141170
17200257
64067288
64093901
64264125
64155945
64155946
64155947
64155948
64155949
64155950
64155951
64057614
64098677
64098678
64059714
| 次ページ |
