HOME > 写真 > 自然・風景 > 宇宙 > 地球
10,000件の写真素材が検索されました。
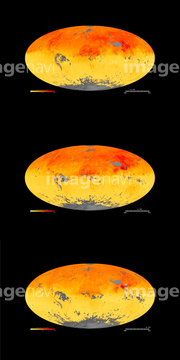
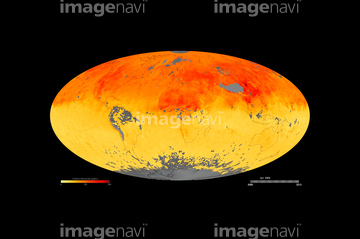
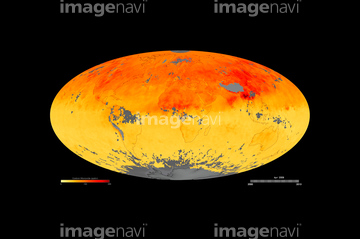
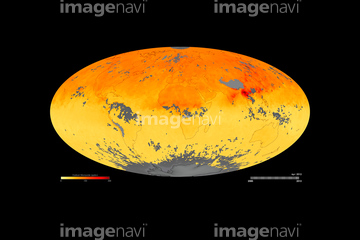
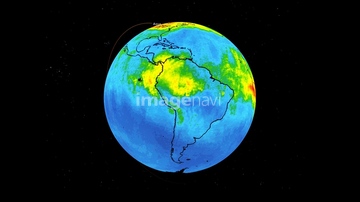
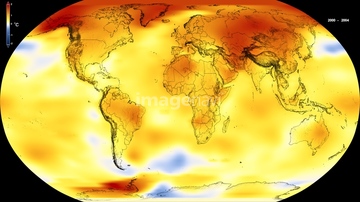
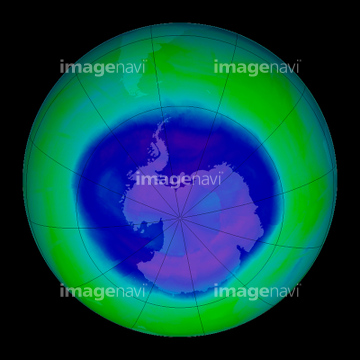
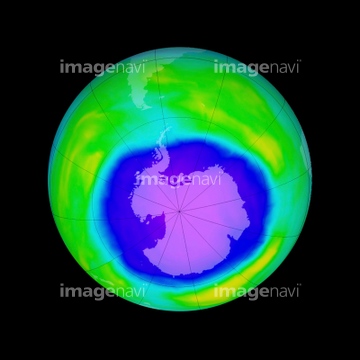
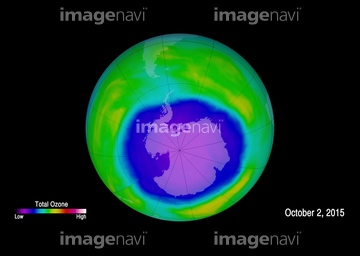
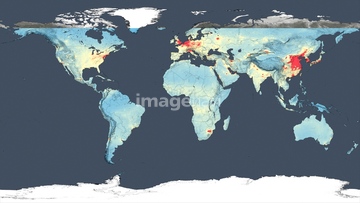
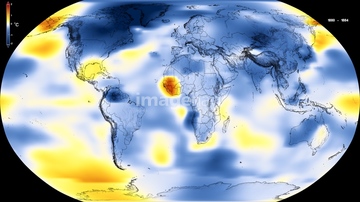
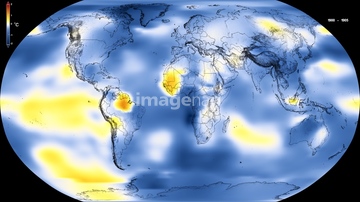
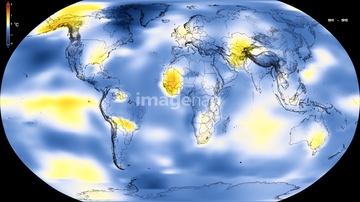
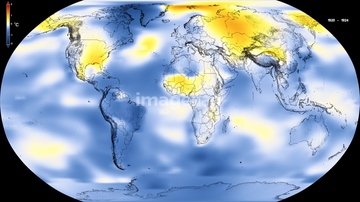
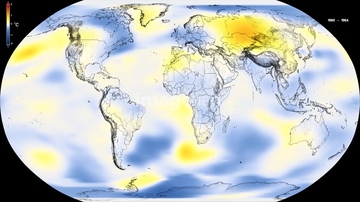
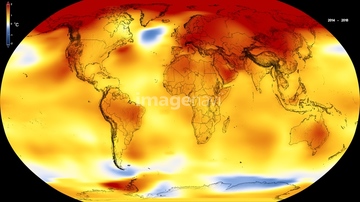
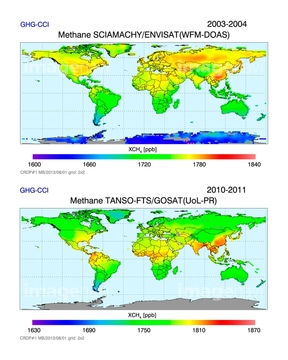
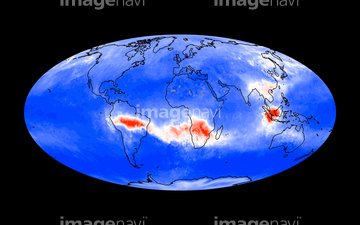
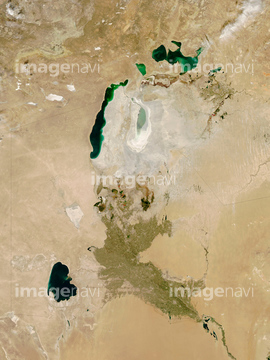
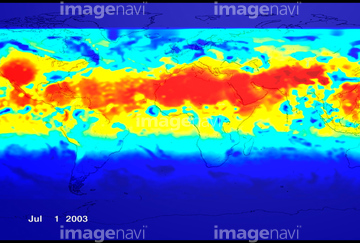
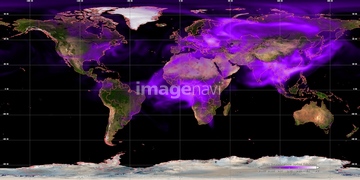
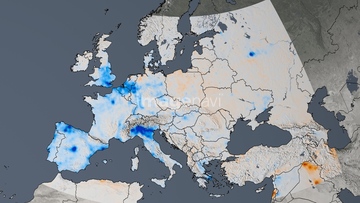
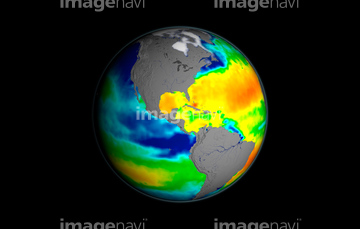
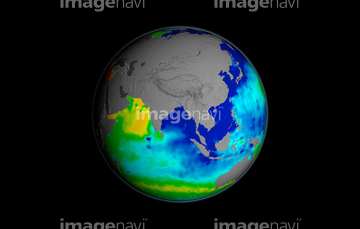
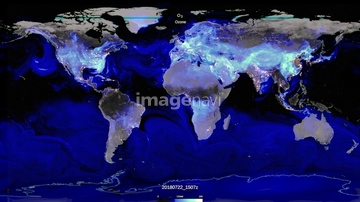
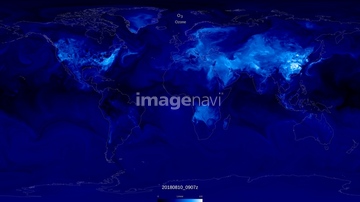
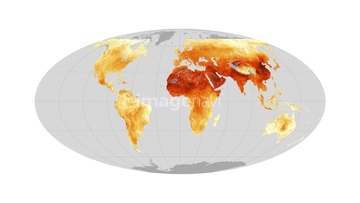
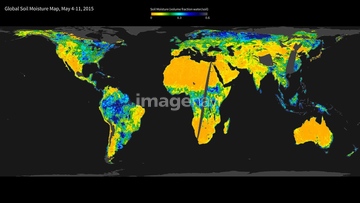
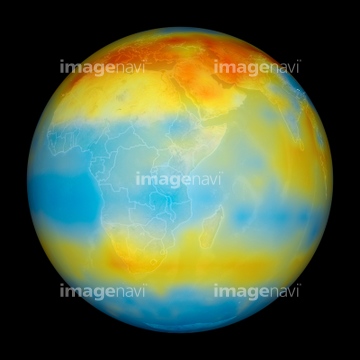
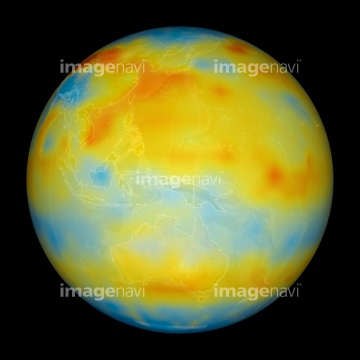
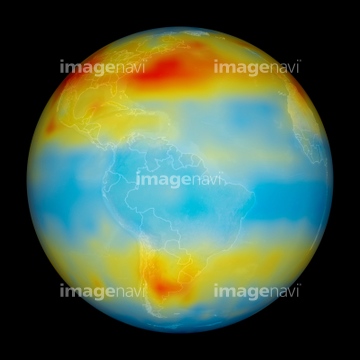
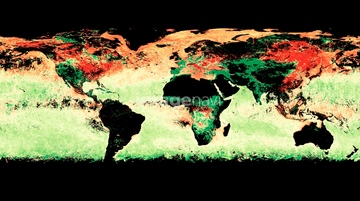
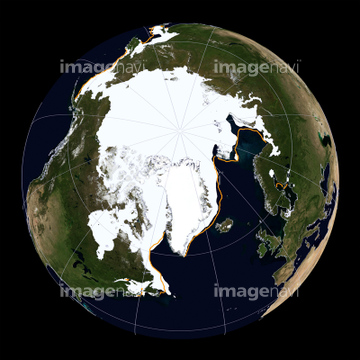
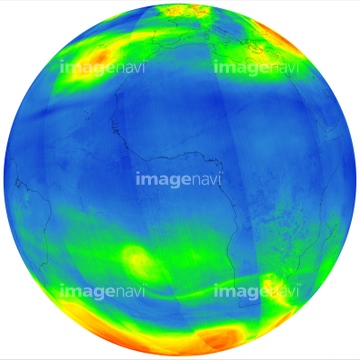
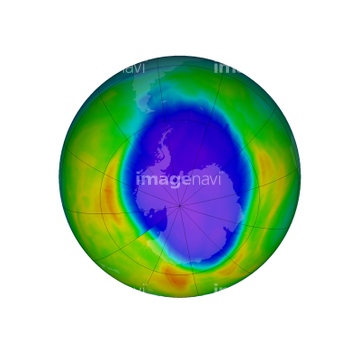
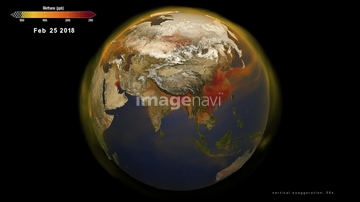
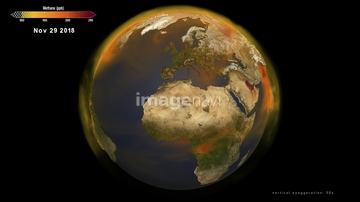
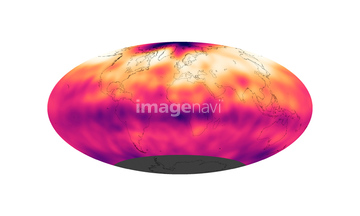
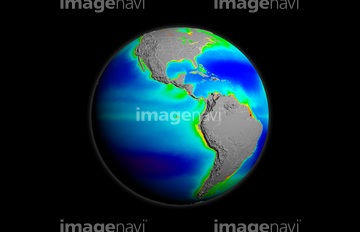
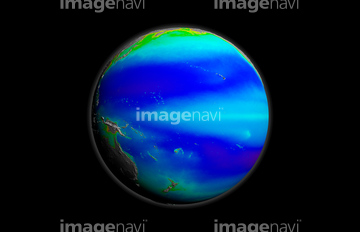
この検索結果には、Global atmospheric methane、Arctic sea ice record low maximum, 2016、Maximum Arctic sea ice extent, 2021、Chelyabinsk meteor explosion、Global carbon monoxide levels, Sep 2002、Aral sea, 2013などが含まれています。
64185241
64011192
64109467
64109468
64185232
64185233
64185234
64185235
64185237
64185238
64185239
64185240
64185236
64075839

64075841
64053691
64053692
64086393
64170956
64200590
64206258
64206259
64237590
64053690
64185242
64185243
64131477

64109527

64109558
64263237
64109421
64215904
64091492
64084875
64084877
64053596
64040007
64040008
64040009
64040010
64040011
64040012
64040013
64040014
64040015
64040016
64041383

64041390
64066734
64074792
64074793
64074871
64075837
64075840
64011207
64168499

64109422
64109483
64085885
64085886
64116457
64116458
64086389
64086398
64091493
64078001
64078002
64078003
64078004
64078005
64257529
64255396
64131456
17200234
64089706
64043123
64220039
64075838
64086428
64072059
64072060
64075191
64075196
64075197
64109502
64109505
64096993
64127735
64053599
64183478
64088450
64263238
64047389
64040980
64067331
64025569
64025570
64025571

64082370
64145778
64173782
64173783
64173784
64040185
64040186
64057044
64218473
64058334
64105944
64106823
64045794
64116186
64116187
64116188
64200497
64075684
64046391
64075594
64075595
64075596
64075597
64129763
64085875
64085876
64085877
64085878
64085879
64085880
| 次ページ |
