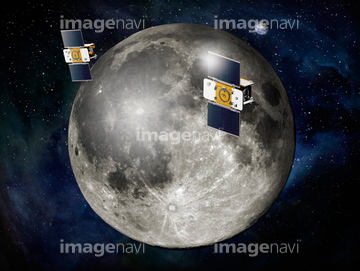
HOME > 写真 > 自然・風景 > 宇宙 > 地球
10,000件の写真素材が検索されました。
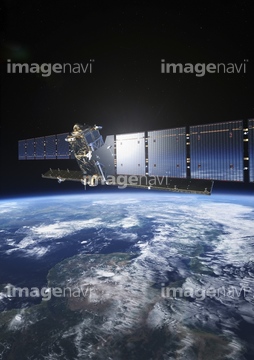
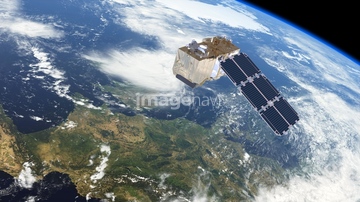
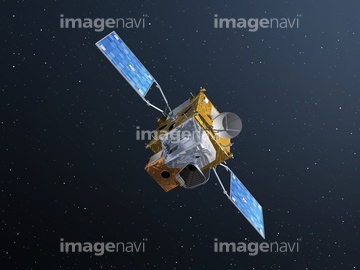
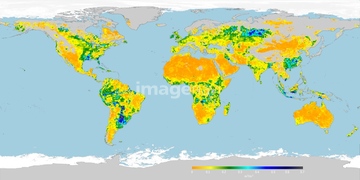
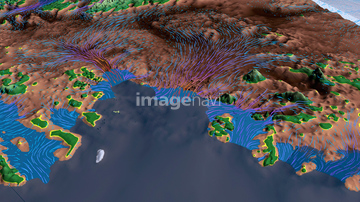
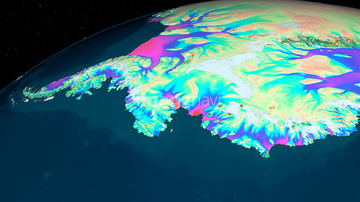
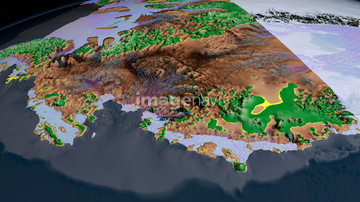
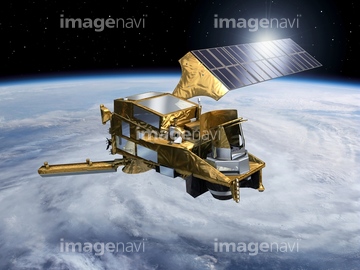
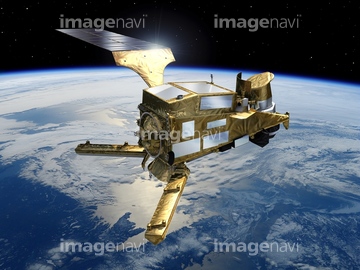
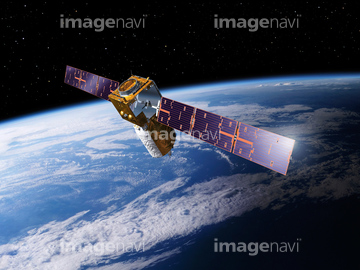
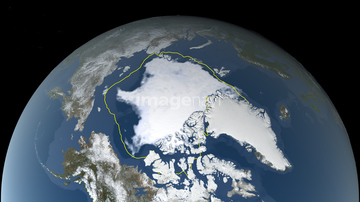
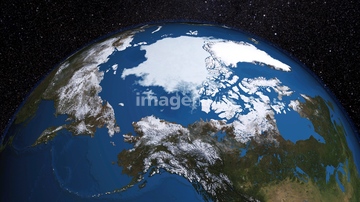
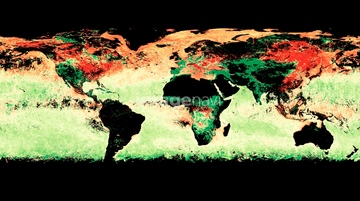
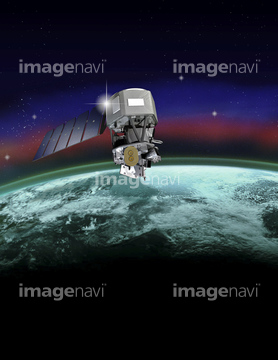
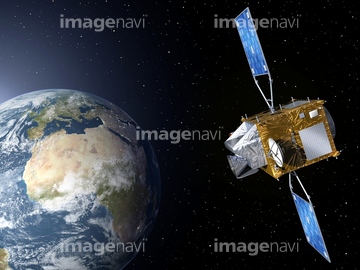
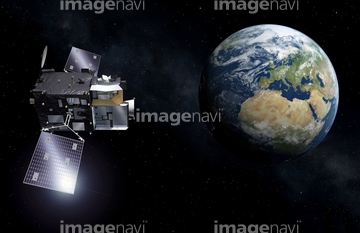
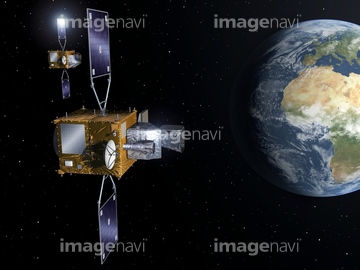
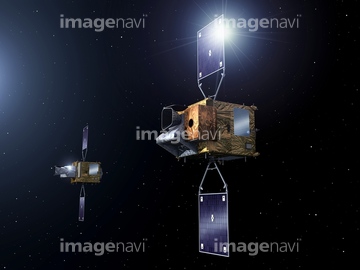
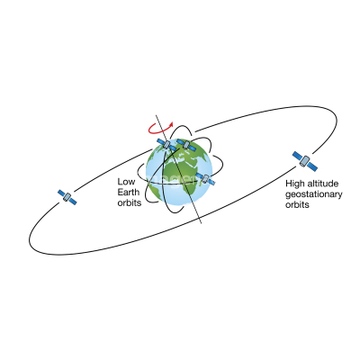
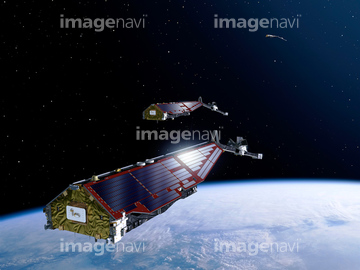
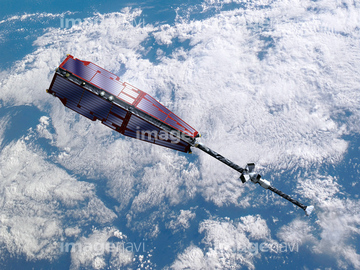
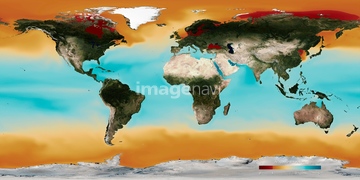
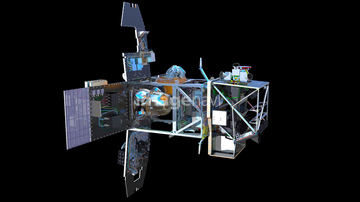
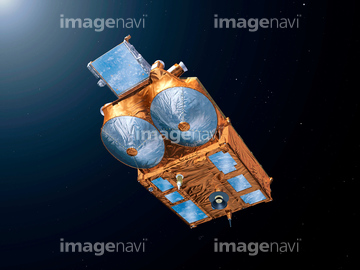
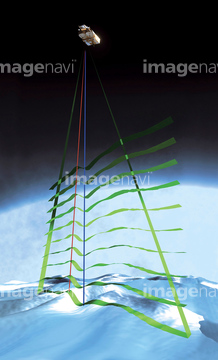
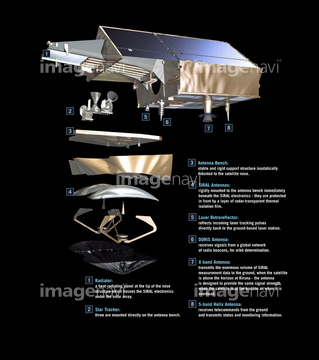
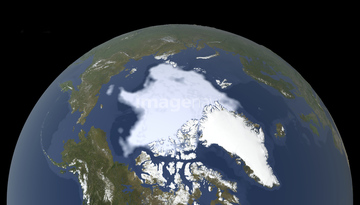
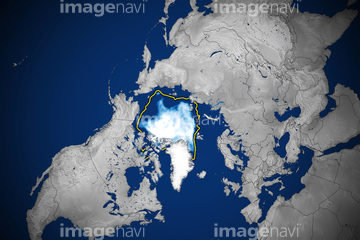
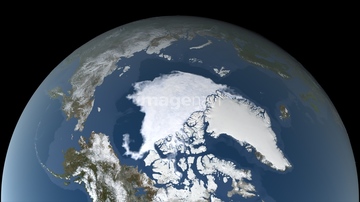
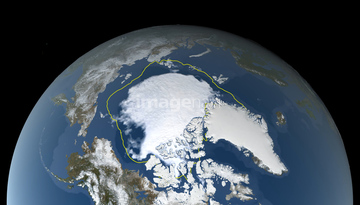
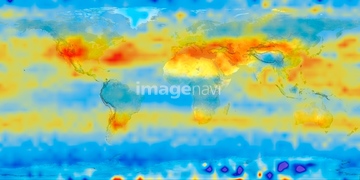
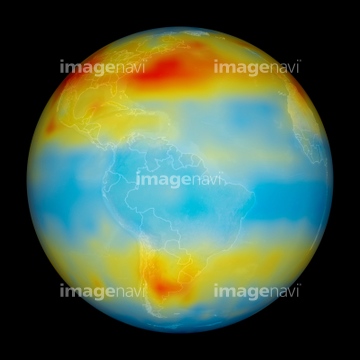
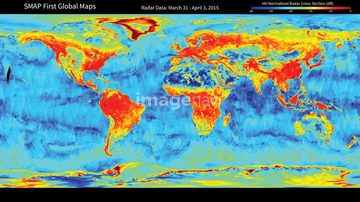
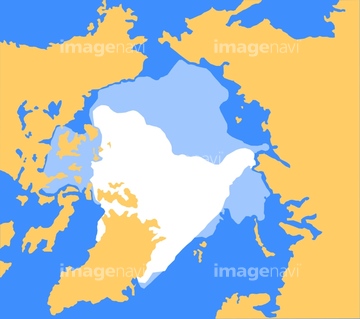
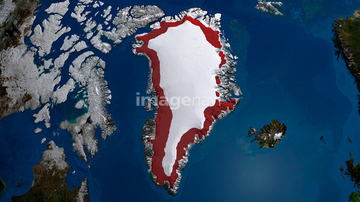
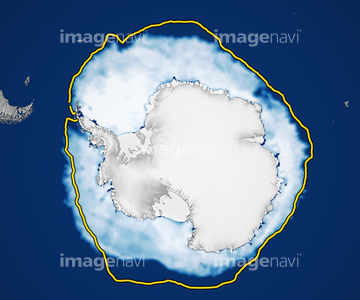
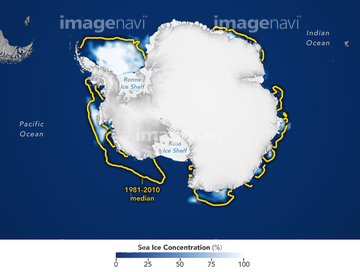
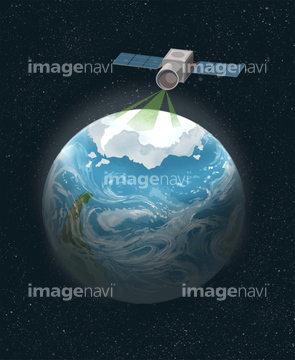
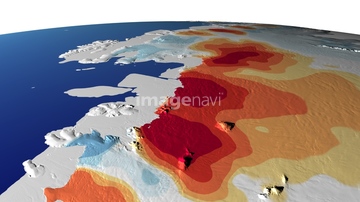
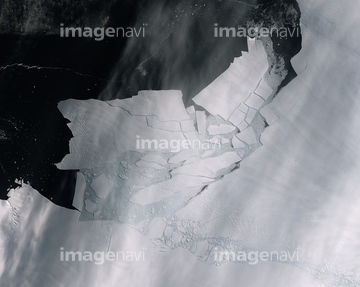
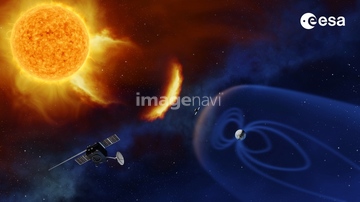
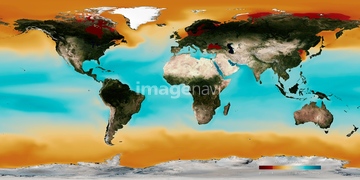
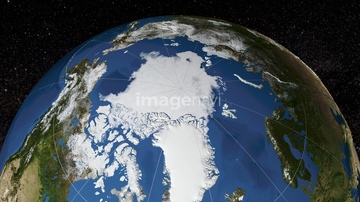
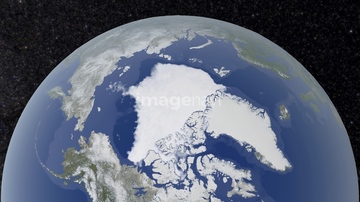
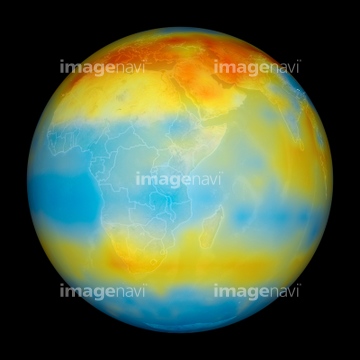
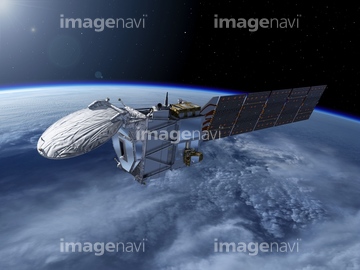
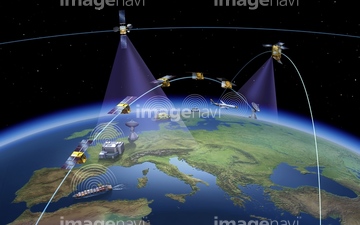
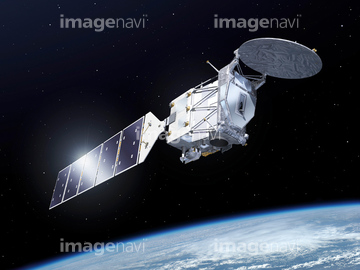
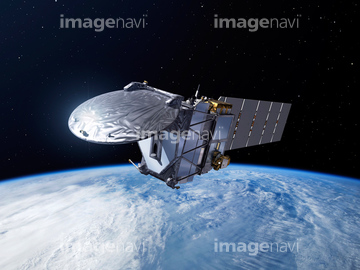
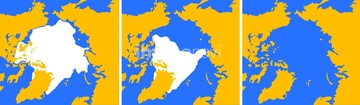
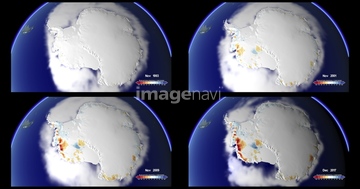
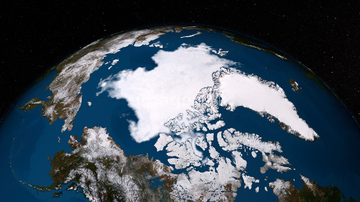
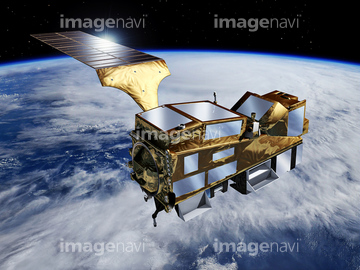
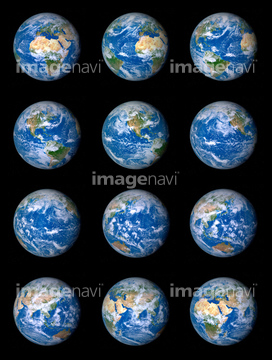
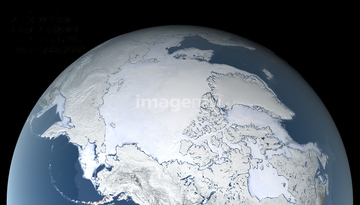
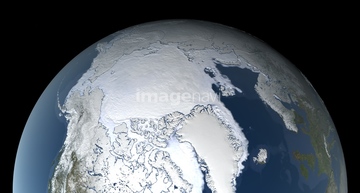
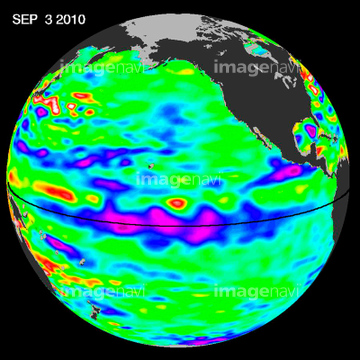
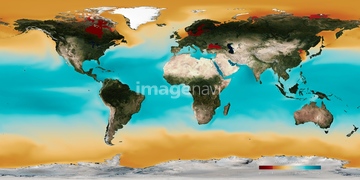
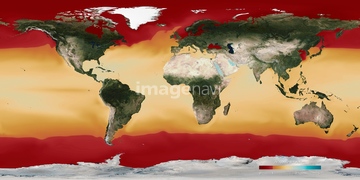
この検索結果には、Cryosat-2 satellite、Cryosat-2 satellite, artwork、Arctic ice minimum extent, 2022、Arctic ice minimum extent, 2020、Arctic ice minimum extent, 2021、Ocean surface pH, 2030などが含まれています。
64119316
64168478
64097616
64097622
64121962
64262469
64093900
64093901
64093902
64097599
64257411
64105772
64072653
64072654
64161003
64086419
64091461
64091462
64109564

64109440

64109462
64109471

64109472

64109509
64121960
64045640
64045641
64045643
64045644
64045653
64045654
64045655
64255401
64257399
64204971
64247623

64109441

64109442

64109463

64109464
64109503
64109505
64086442
64049160
20543664
64088702
64092867
64092868
64264125
64125843
64091492
64125454
64204748
64168473
64014702
64109433
64109438

64109443
64109444
64109460

64109465
64045642
64053700

64109422

64109439

64109461
64109470

64109473

64109475

64109527

64109558

64154867
64169502
64109502
64109508
64091433
64072651
64072652
64116457
64116458
64103757
64255140
64262470
64253216
64253217
64253228
64097601
64097602

64092865
64092866
64011192
20543741
64073495
64100573
64097551
64058016
64058017
64168425
64256566
64253111
64253112
64111791

64111792
64014701
64178179
64106266
64194875
64168465
64075082
64260979
64204970
64215904
64050576
64159711
64109466
64109469
64109476
64088681
64168476
64081457
64081459
64081460
17262366
17262367
17262368
64217603
64257903
64257904
64192700
64217602

64141170
| 次ページ |
