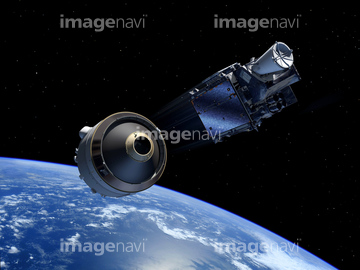
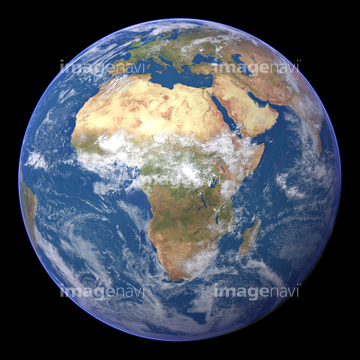
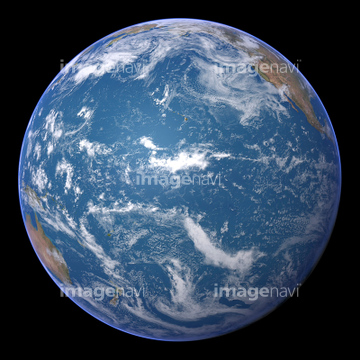
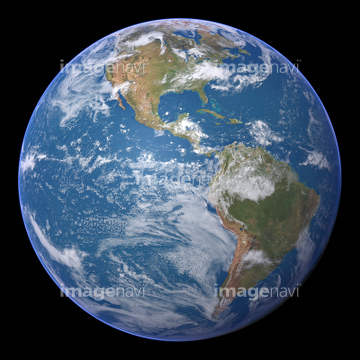
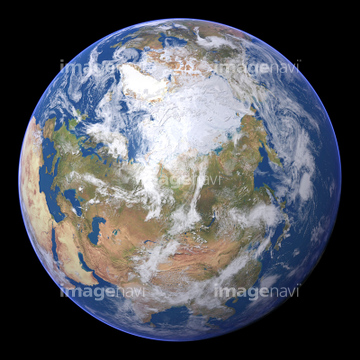
HOME > 写真 > 自然・風景 > 宇宙 > 地球
10,000件の写真素材が検索されました。
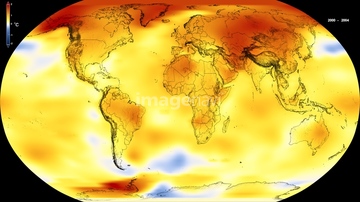
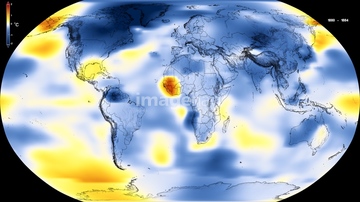
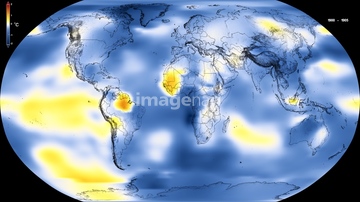
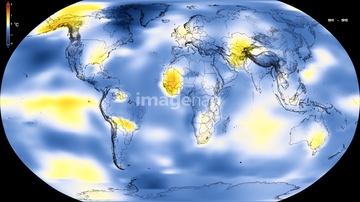
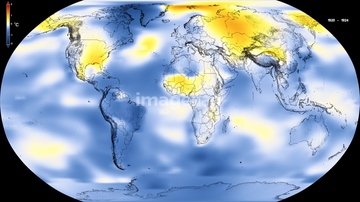
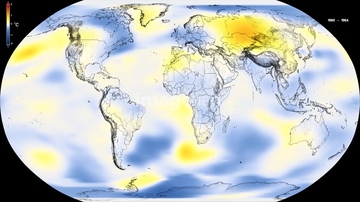
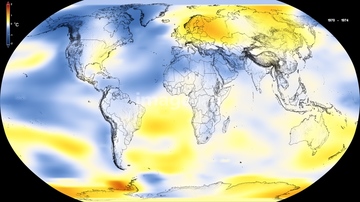
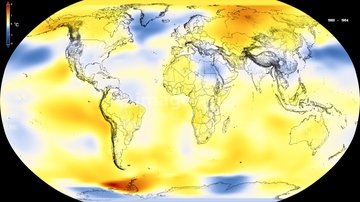
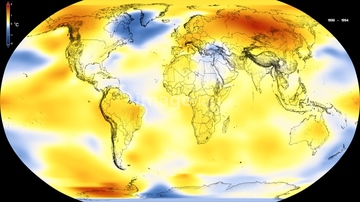
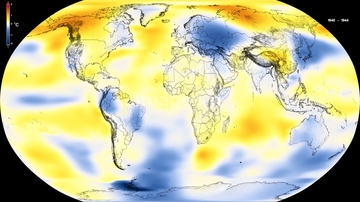
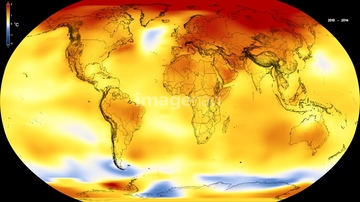
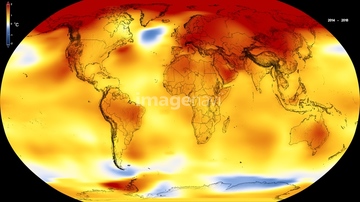
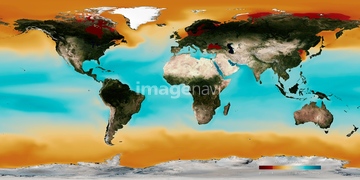
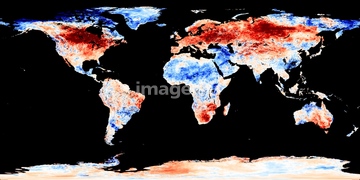
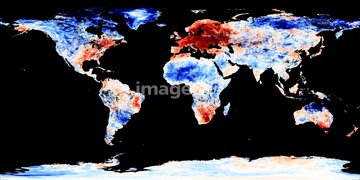
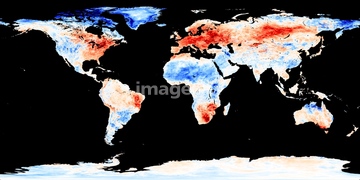
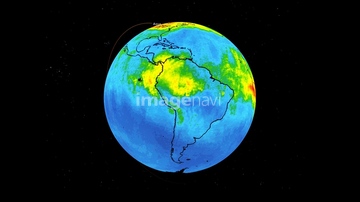
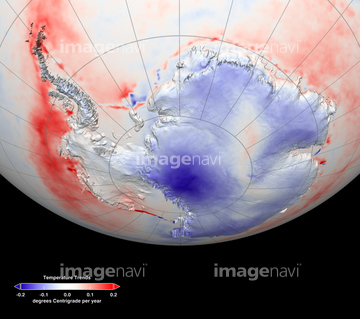
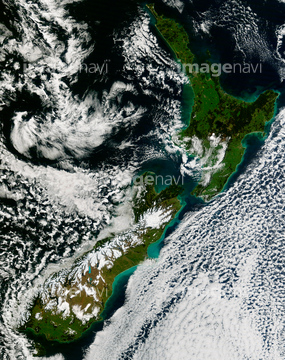
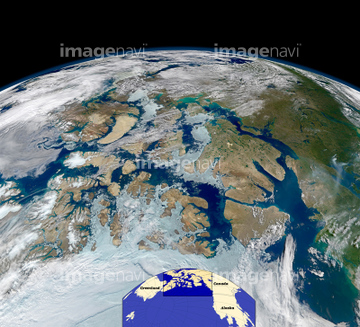
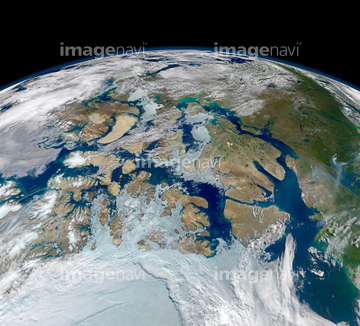
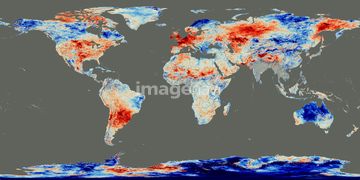
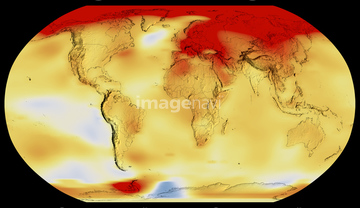
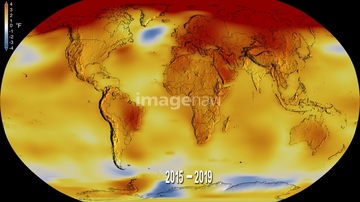
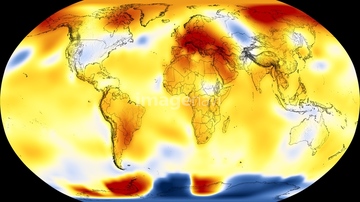
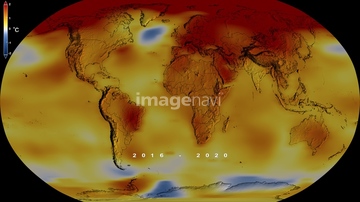
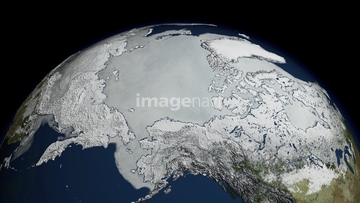
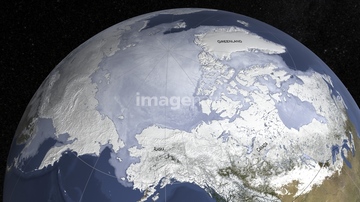
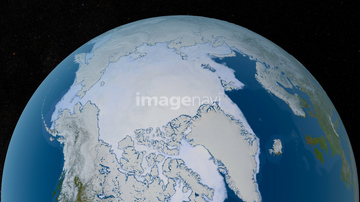
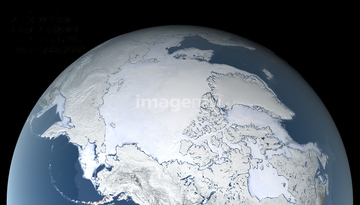
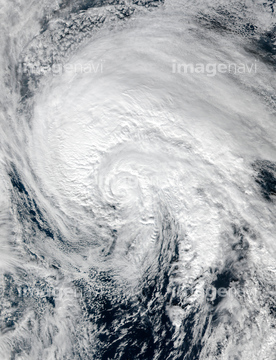
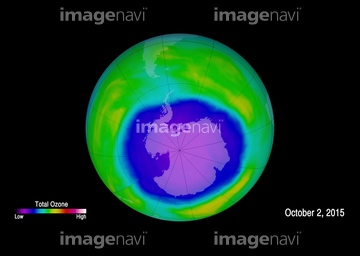
この検索結果には、Maximum Arctic sea ice cover, 2015、Antarctic temperature trends, 1982-2003、New Zealand, satellite image、Open Northwest Passage, 2012、Summer heatwave, 2006、Global temperature anomalies, 2018-2022などが含まれています。
64185241
64185232
64185233
64185234
64185235
64185237
64185238
64185239
64185240
64185236
64185242
64185243

64041390
64129763
64215904
17200234

64109439
64041383

64109461
64011192
64074871
64046391
64050840
64263237
64218473
64116457
64116458
64178179
64257529
64014670
64109470
64116186
64116187
64116188

64109527

64109558
64210700
64088450
64260979

64106283
64040980
64058420
64058421
64014771
64085886
64043123
64220039
64040007
64040008
64040009
64040010
64040011
64040012
64040013
64040014
64040015
64040016
64074792
64074793
64053690
64064294
64088728
64242042
64062174
64062175
64053325
64043083
64092867
64088702
64075839

64075841
64152465
64260136
64067331
64168208
64014421
64097599
64088667
17200257
64263238
64183478

64041230
64141450
64162892
64204970
64116185

64109422
64218100
64203337
64173143
64173144
64040166
64040203
64040204
64040205
64040206
64257903
64257904
64192700

64109509
64040185
64040186
64217602
64044741
64086393
64089706
64084875
64084877
64053596
64053691
64053692
64066734
64075837
64075838
64075840
64011207
64061242
64062373
64044426
64044427
64044794
64044795
64044796
64047887
64047888
64014702
64067282
64067288
64067291
64067330
64067805
64011489
64011490
64046247
64262469
64152471
64121443
64121445
64139332
64009992
64010000
64010005
64109467
64109468

64048529
17200249
17200250
| 次ページ |
