HOME > 写真 > 自然・風景 > 宇宙 > 地球
10,000件の写真素材が検索されました。
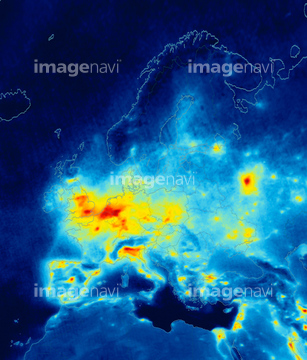
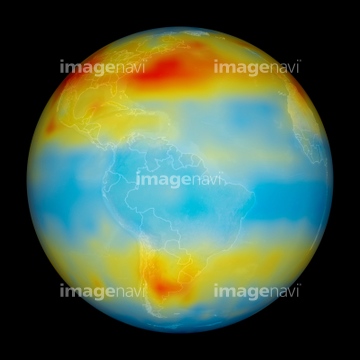
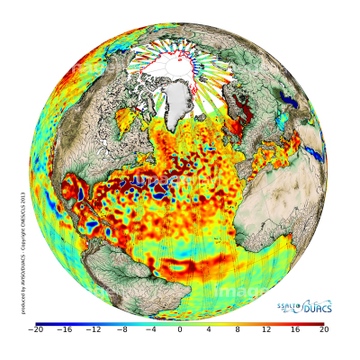
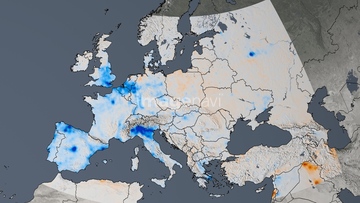
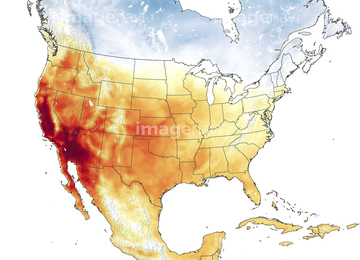
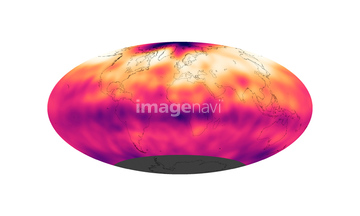
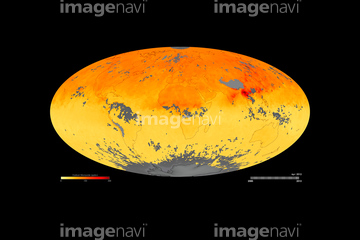
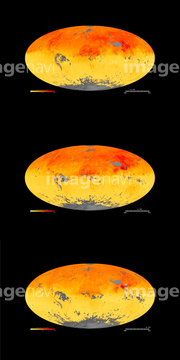
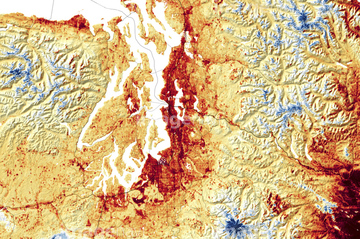
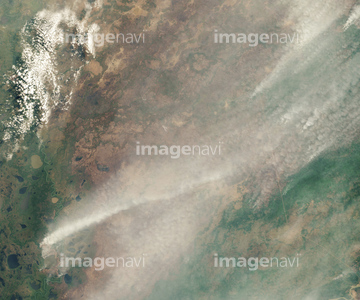
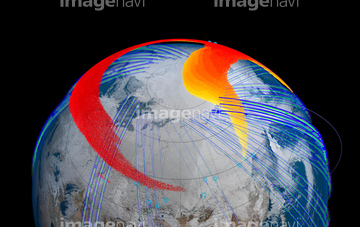
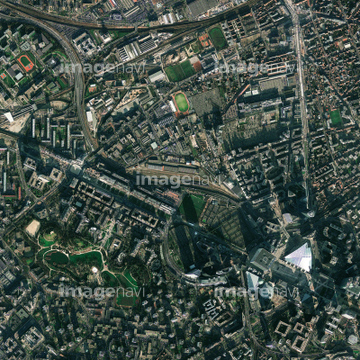
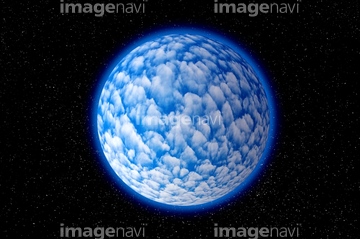
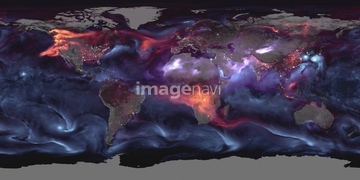
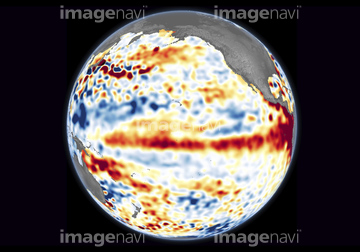
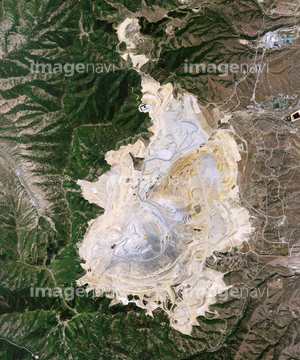
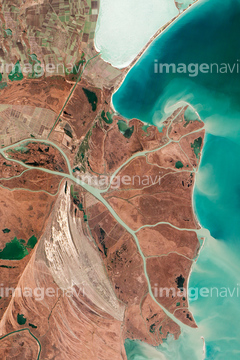
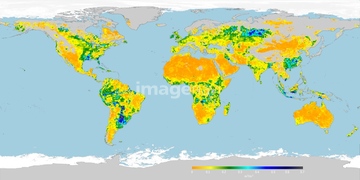
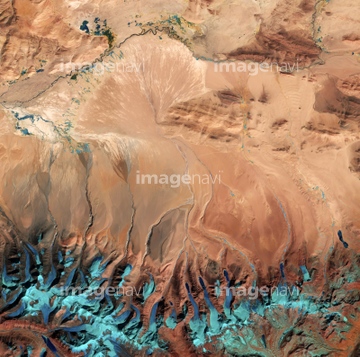
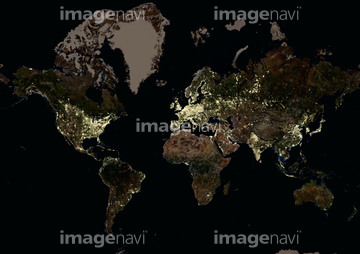
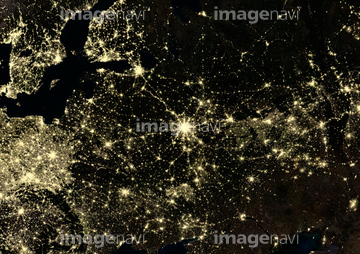
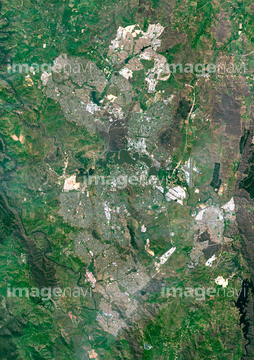
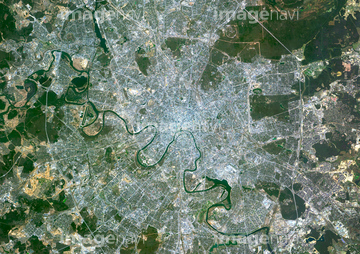
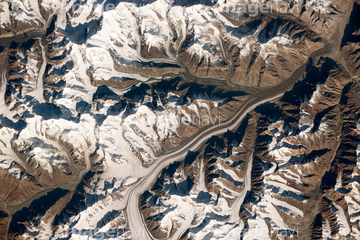
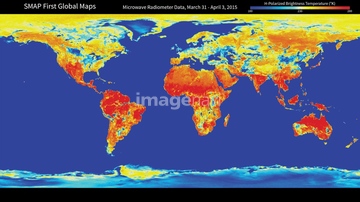
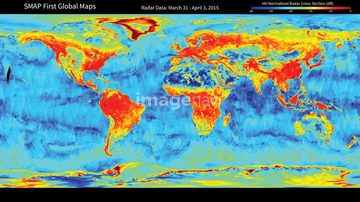
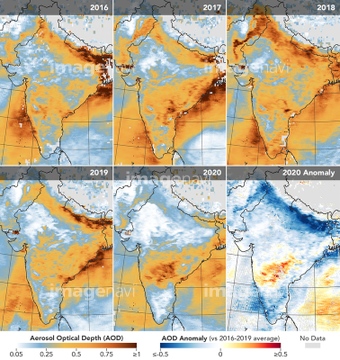
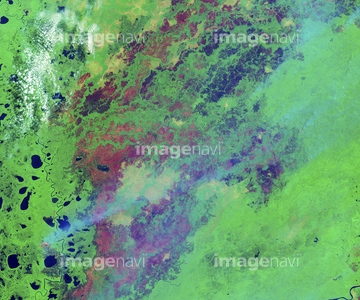
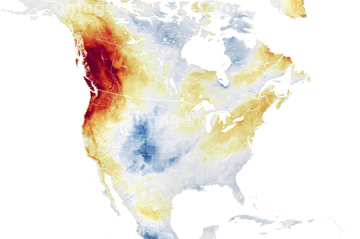
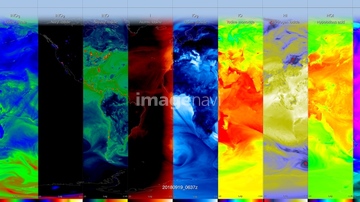
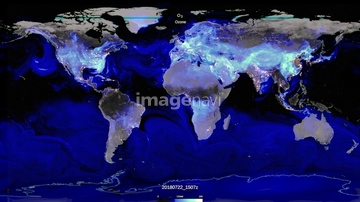
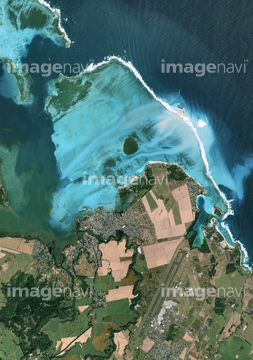
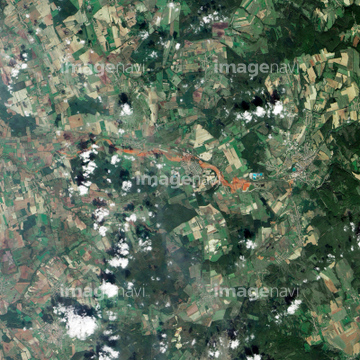
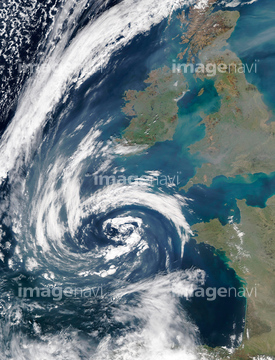
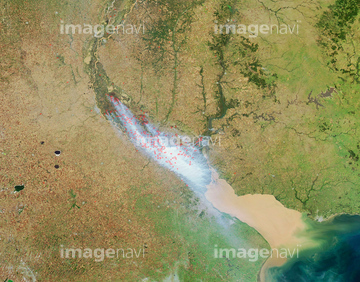
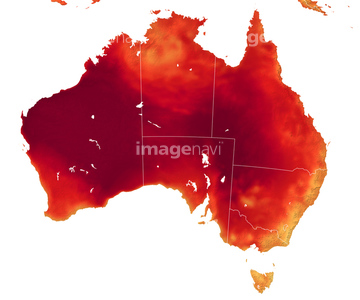
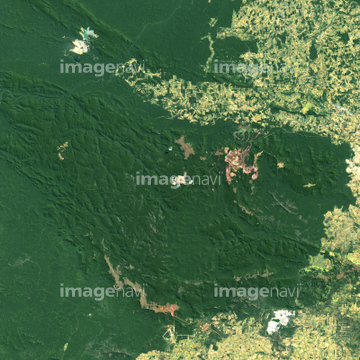
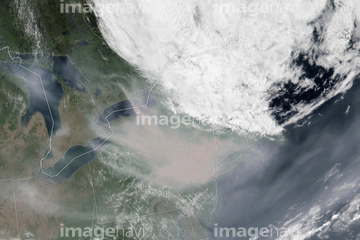
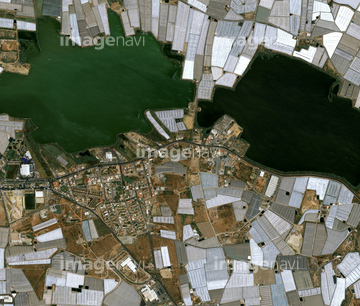
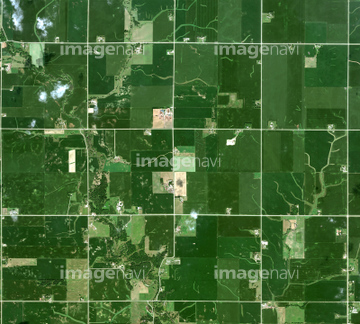
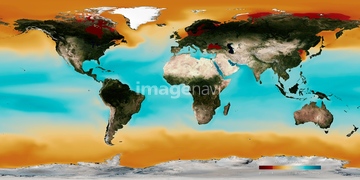
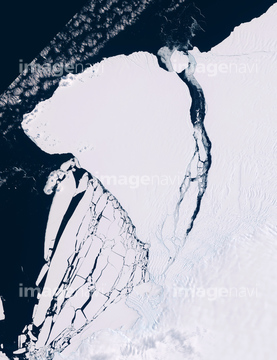
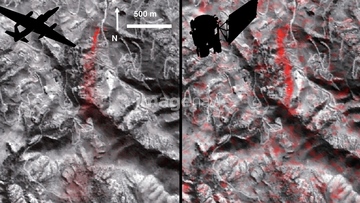
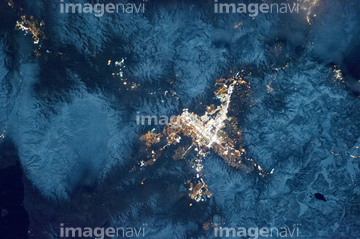
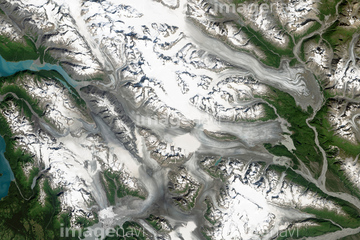
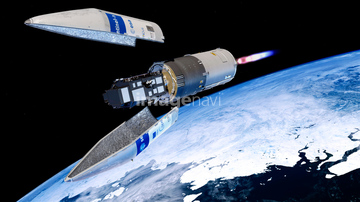
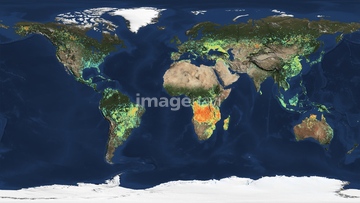
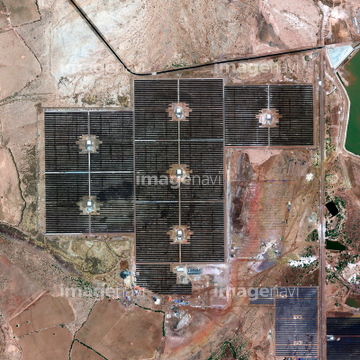
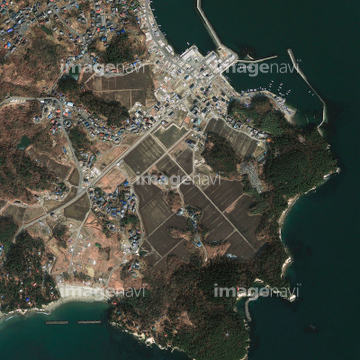
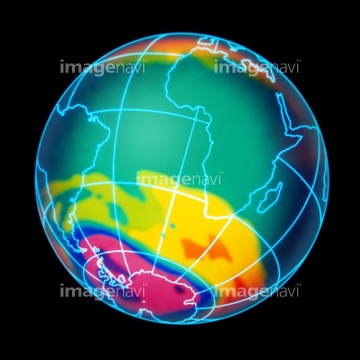
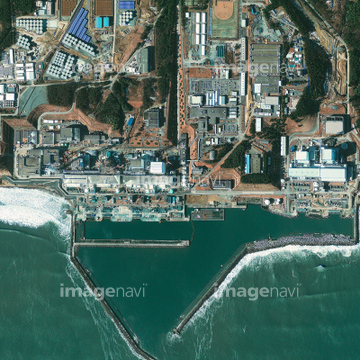
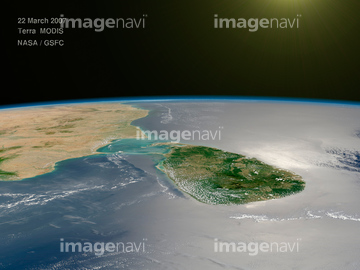
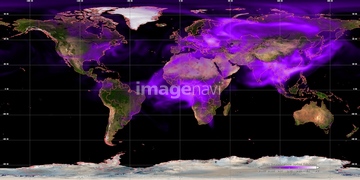
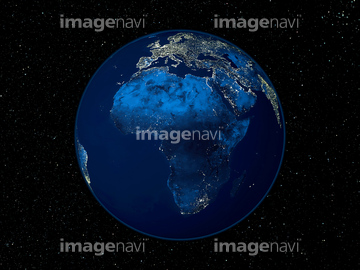
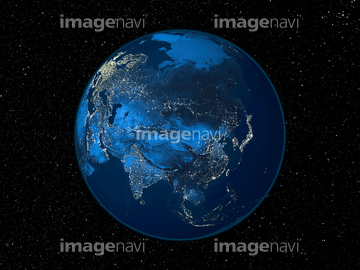
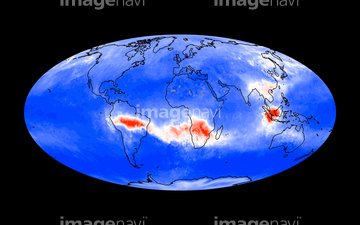
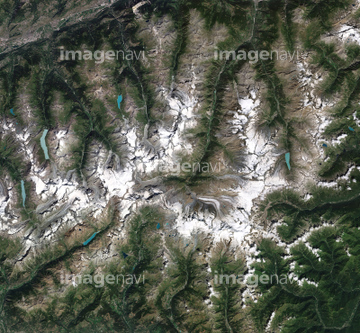
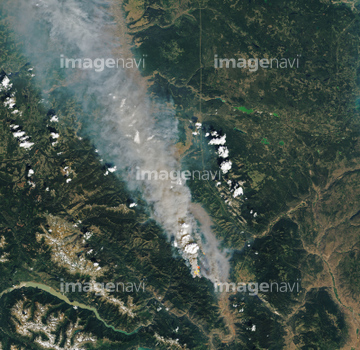
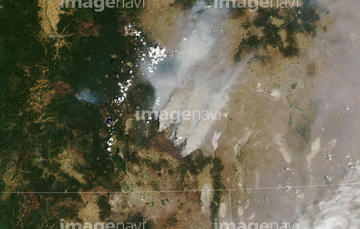
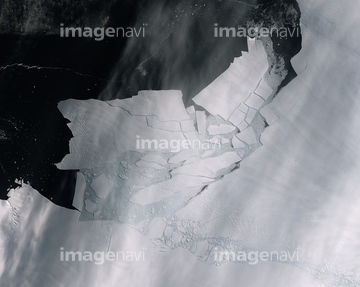
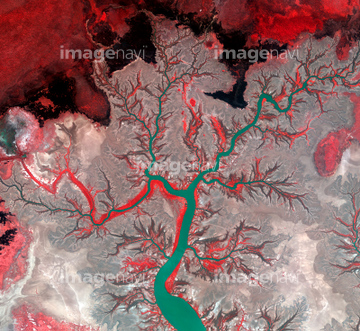
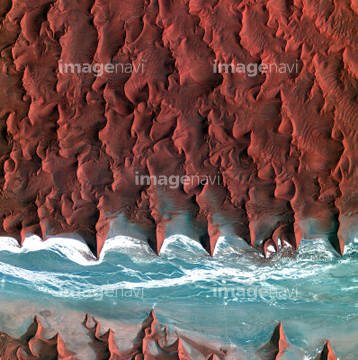
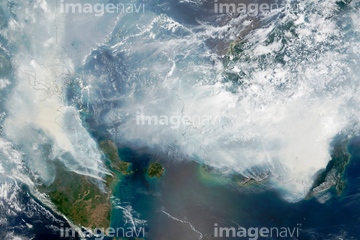
この検索結果には、Atmospheric aerosols, August 2018、El nino, June 2023、Bingham Canyon Mine landslide, USA, 2013、Danube Delta, satellite image、Global soil moisture, May 2016, satellite image、Tibetan Himalayas, satellite imageなどが含まれています。
64109503
64109505
64141170
64109502
64200590
64203337
64092867
64092868

64109461
64262469
64218100
64091492
64059356

64106283
64206258
64206259
64237590
64092866

64109465
64109421

64109439

64109462

64109463

64109464
64090803
64170956
64263237
64091493
64141184

64109527

64109558
64098666
64098667
64098673
64098680
64098681
64098684
64098688
64098690
64098696
64098702
64059340
64059343
64059347
64059349
64059350
64059352
64059353
64059355
64059357
64059362
64059363
64072059
64072060
64197367
64141174
64045794
64211646
64056070
64056071
64056072
64255396
64109444
64109460

64041230
64084877
64200497
64093933

64109443
64097610
64059714
64011192

64109440

64109441

64109442

64109473

64109475

64109509

64109563
64098677
64098678
64257529

64092865
64109470
64208339
64263238
64125447
64090810
64141171
64098693
64131456
64168478
64097616
64059339
64059361
64059345
64089705
64109483
17200249
17200250
17200251
17200253
17200255
64043836
64043838
64211648
64219634
64219636
64087305
64087306
64109467
64109468
64109506
| 次ページ |
