HOME > 写真 > 地図・衛星写真 > 衛星写真 > 地球
10,000件の写真素材が検索されました。
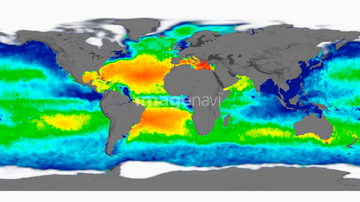
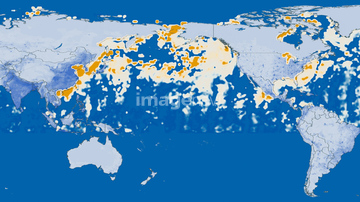
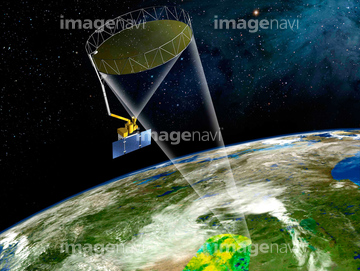
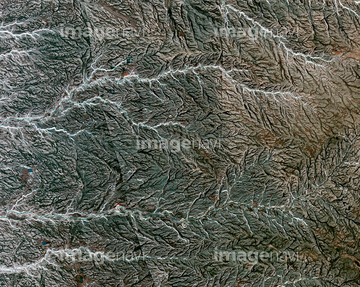
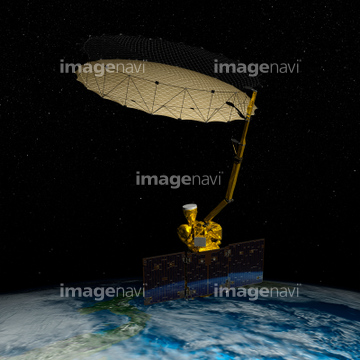
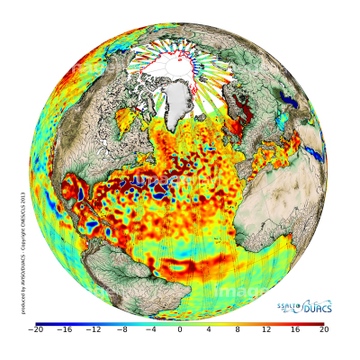
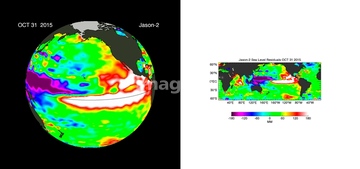
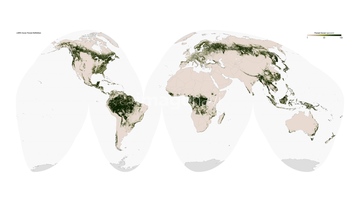
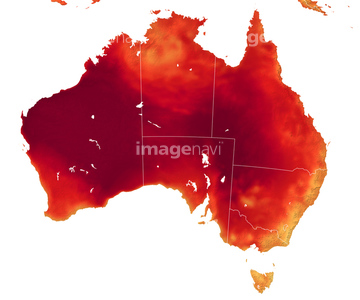
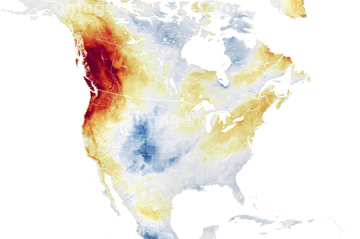
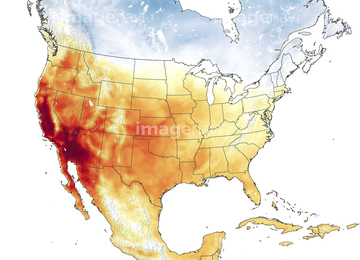
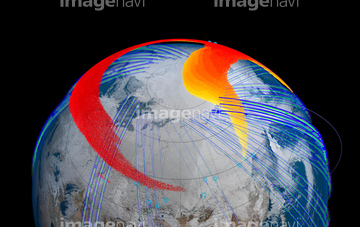
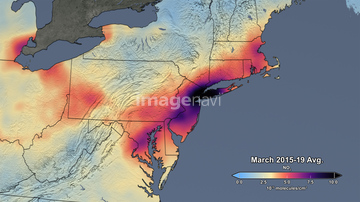
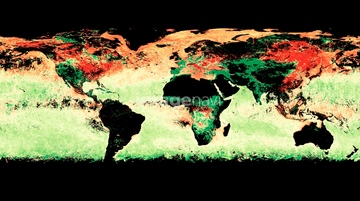
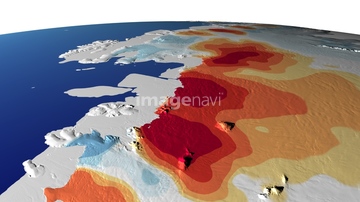
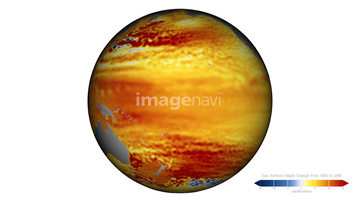
この検索結果には、Global forest cover, satellite image、Deep ocean temperature changes、Australian heatwave, 2022、Pacific Northwest heatwave, June 2021、California heatwave, September 2020、Chelyabinsk meteor explosionなどが含まれています。
64200590
64255396
64109467
64109468
64206258
64206259
64237590
64173784
64145778
64173782
64173783
64011192
64074885
64109421
64079777
64085887
64109483
17262368
64217602
64047887
64047888
64192700
64075588
64075590
64100576
64141170
64109501
64109562

64109563
64257529
64203337
64091492

64081457
64081459
64081460
64066108
64066109
64066110
64066111
64066113
64067274
64067275
64067276
64067277
64067279
64067805
64109745
64109747
64109750
64131456

64088450
17212723
17262371
17262378
17262381
17266911
64078166
64078167
64078186
64171614
64062174
64062175
64044035
64075792
64257903
64257904
64047394
17266919
64112894
64112895
64125447
64109502
64109503
64109505
64051872
64051873
64086428

64109422

64109527

64109558
64263237
64263238
64053690
64072059
64072060
64075191
64075196
64075197
17212855
64098672

64097621
64066734
17242710
64060128
64060129
64096993
14915396
14915400
14911137
14911138

14910067

21855545
64087097
64048263
64091461
64091462
64168478
64097616
64253424
64253425
64253426
64253427
64253428
64075684
14911102
14911103
14911129
14911130
14911132
14911133
14910064
14910065
14910066
14910068
14910069

14910070
14910071
14910072
14910079
10117313
| 次ページ |
