HOME > 写真 > 産業・環境問題 > エネルギー・エコロジー > 環境破壊・汚染
10,000件の写真素材が検索されました。
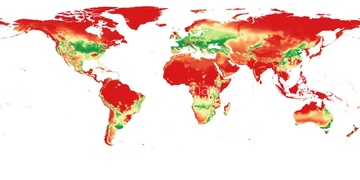
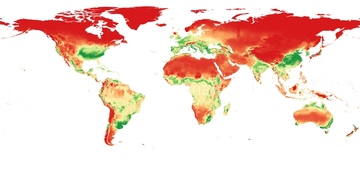
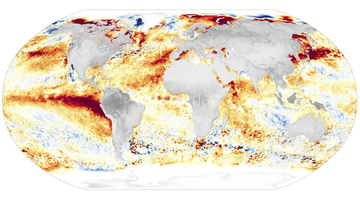
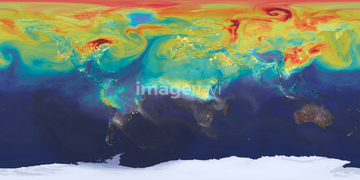
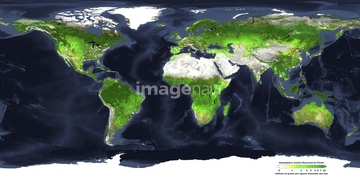
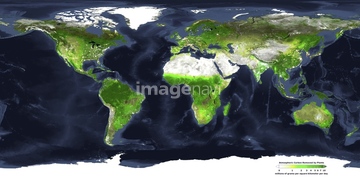
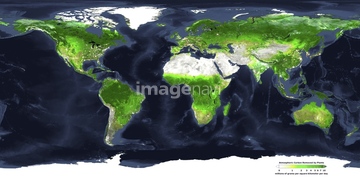
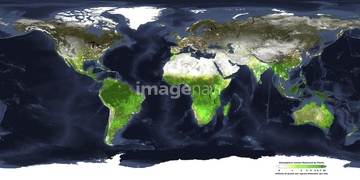
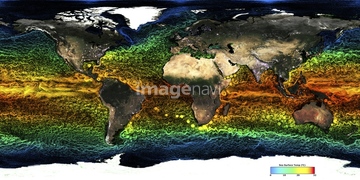
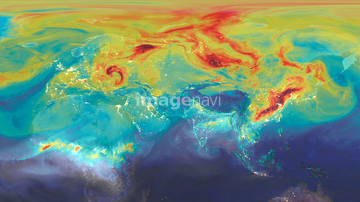
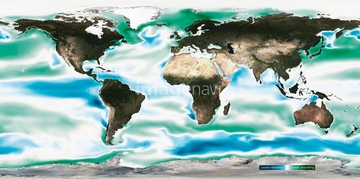
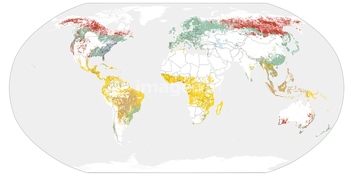
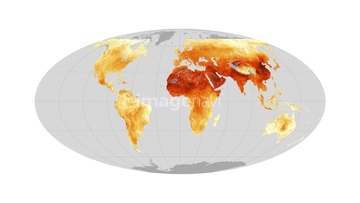
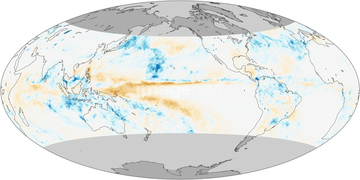
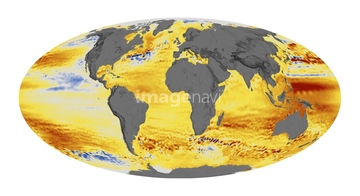
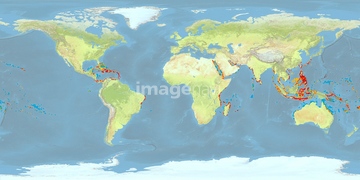
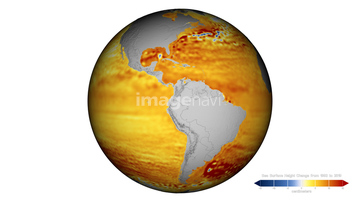
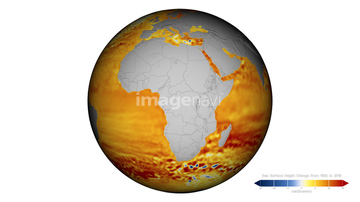
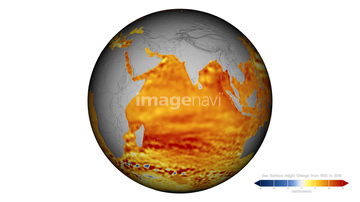
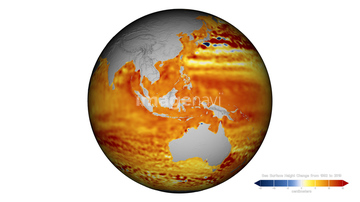
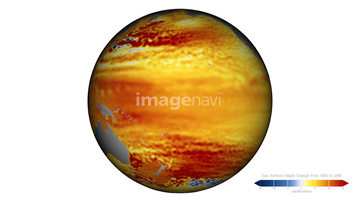
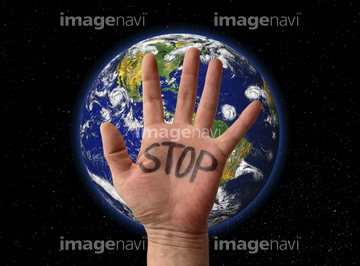
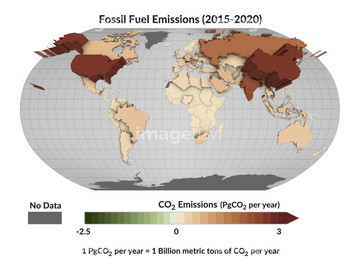
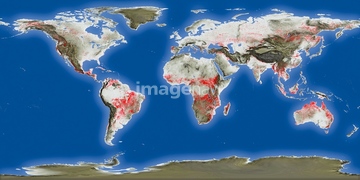
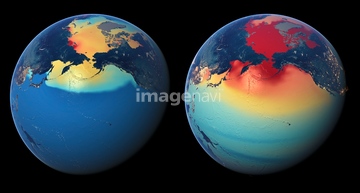
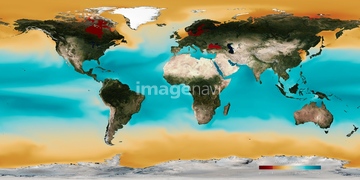
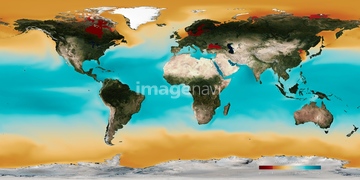
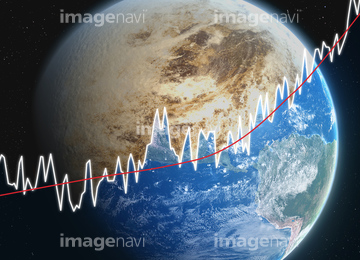
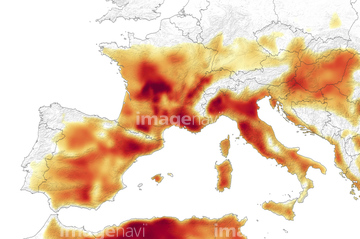
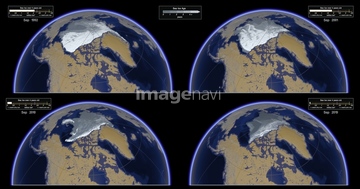
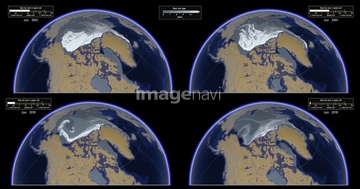
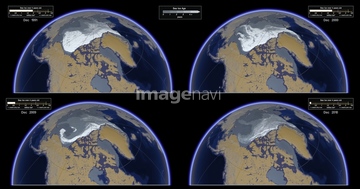
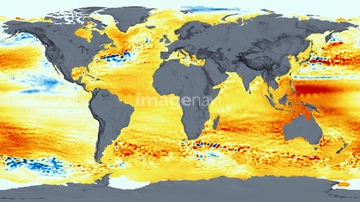
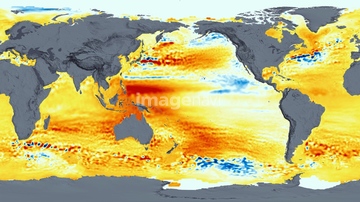
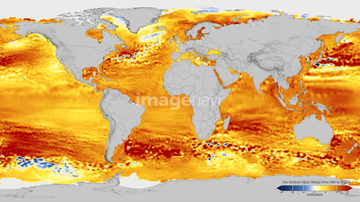
この検索結果には、Environmental care, conceptual image、Ocean surface pH, 1861、Ocean surface pH, 1945、Ocean-atmosphere CO2 exchange, 1861、Ocean-atmosphere CO2 exchange, 1945、Map showing changes to the Earth's tree coverなどが含まれています。
64203130
64203129
64254063
64201808

64109563
64201790
64254089

64109439

64109461
64262548
64201791
64113454
64203337

64109489
64109490
64257903
64257904

64109440

64109441

64109442

64109462

64109463

64109464

64109473

64109475
64256538
64218100

64109527

64109558
64112895
64145885
64109433
64109438
64109444
64109460
64047888
64190779
64192700
64109488
64253424
64253425
64253426
64253427
64253428
64263464

64113443
64071961

64109443

64109465
64109476
64201796
64201797
64201798
64201799


64257529

64011300

64109509
64105944
64190451
64109501

64106283
64144994
64109466
64109469
64046247

64041390
64109470
64109503

64041230

64045846
64053576
64205161
64109471
64097254
64014575

64011298
64011299
64011303
64011304
64011305
64011306
64014939

64145886
64047887
64014421
64091478

64113444
64203131
00043257
00043258
64047483
64047484
64130289
64188515
64188516
64190777
64194955
20562554

64043474
64074101
64112898
64112899
64253422
| 次ページ |
