HOME > 写真 > イラスト・CG > CG > 合成写真
10,000件の写真素材が検索されました。
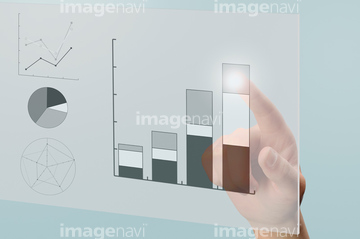
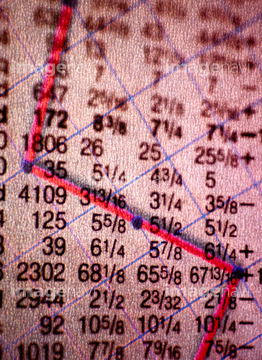
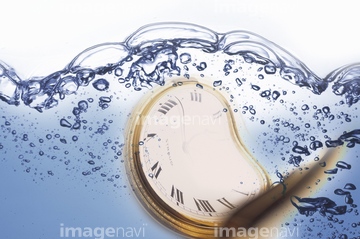
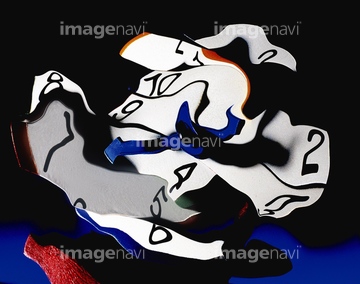
この検索結果には、ビジネスイメージ、地球と棒グラフ CG、成績グラフイメージ、車とグラフイメージ CG、船とグラフイメージ CG、地球とビルなどが含まれています。
30038420
30038418
30022139
30028984

14907363

11613613
30038419
30038725
16001733

14904987

14906606
40024255

16936021

30038335

14907620
11611484
11611486
21853711
10317007
10317181
21853938
40015314
30038403

14906602
30022188
16923271

14904617
10917620
21850556
30022133
30038197
30022180
11611485
31270848
30022154

14904984
10328461
10328489
10328504
10328560
21853715

14907621
21852037

14906608

14907627

14906609

00048104
19790766
19790767
40025849
40025850
40025867
40025868
40025869
30022160
11611487
21852090
10317178
40025851

11617361
10317179
31270839
31270840
31270841
31270842
31270843
31270844

31270845
31270846
31270847

11617378
31158338
31158339
31158340
31158341
31158342
31158343
31158344
31158345
31158346
31158347
31158348
10328473

14907615

14906610

00048105
19790765

14904992
30027643
30038735
10115337

14905404
10328537
30022170

17269454

40012831
16936491

14904982

00005944
11611242
30431734
30022192

40085203
30022165
30022184

11617405
40012823
40012837
40012838

40012843
40012878

16933646
21853716

14907618

16936501
31270834
31270835
31270836
31270837
31270838

31270849

31270850
31270851
31270852
31270853
31270854
31270855
31270856
31270857
31270858
31270859
31270860
31270861
31270862

31270863
31270864

31270865
31270866
31270867
31270868
31270869
31270870
31270871

31270872
31270873
31270874
31270875
31270876
31270877
31270878

31270879
31270880
31270881
31270882
31270883
31270884
31270885
31270886
31270887
30061601
30061604
40079665

21850289

21850291
10327504
10327507
10327510
10328479
10328512
10328542
10305638
30076761
30038342
30028966
19790764
70237867
70237871

16936498
70035227

11602393
14907364
14909415
30077115
30022193
30038339
20932380
30022149
| 次ページ |
