HOME > 写真 > 自然・風景 > 宇宙 > 地球
10,000件の写真素材が検索されました。
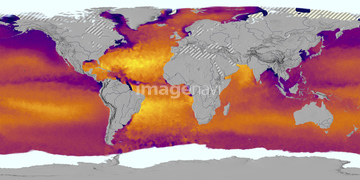
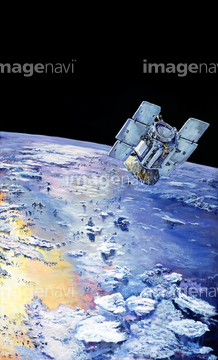
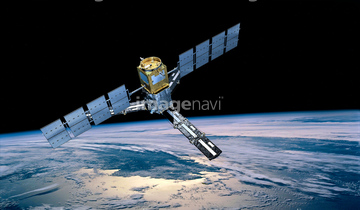
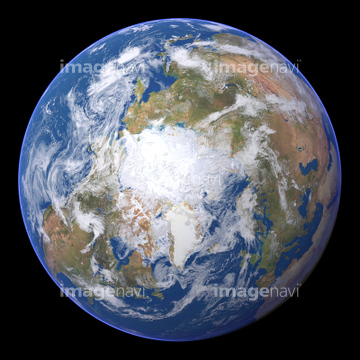
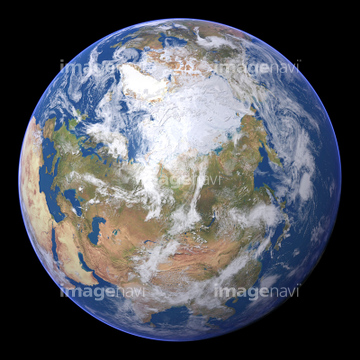
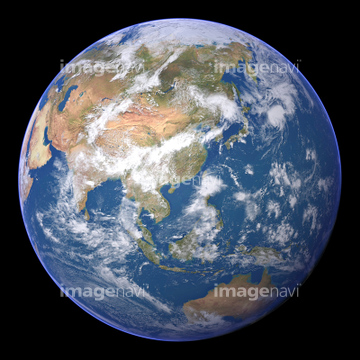
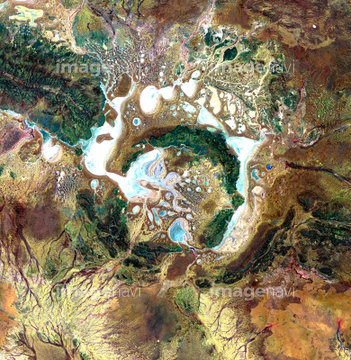
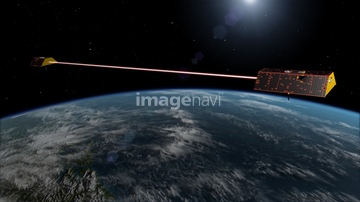
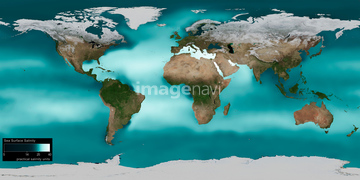
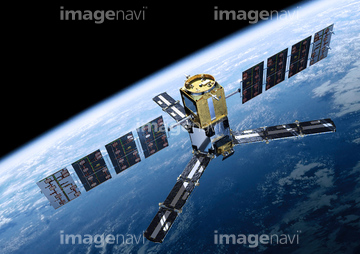
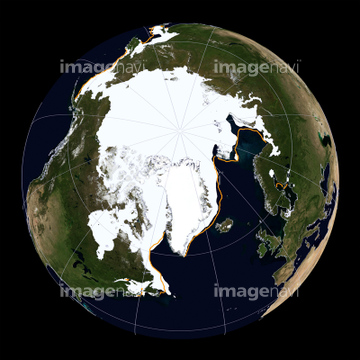
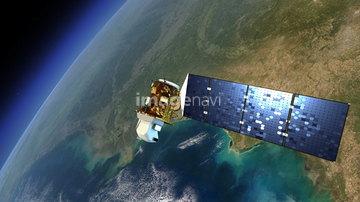
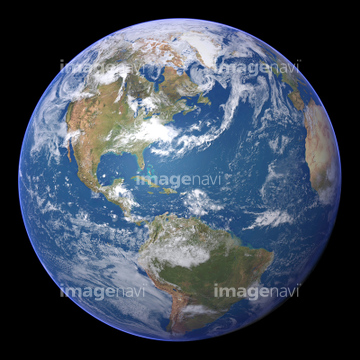
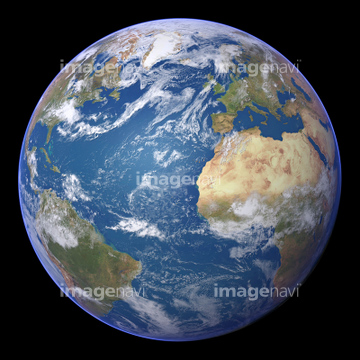
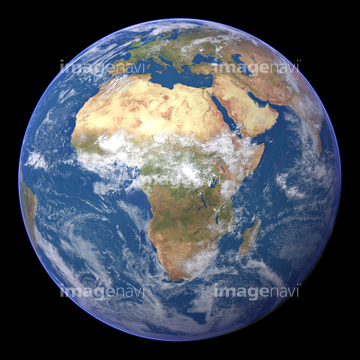
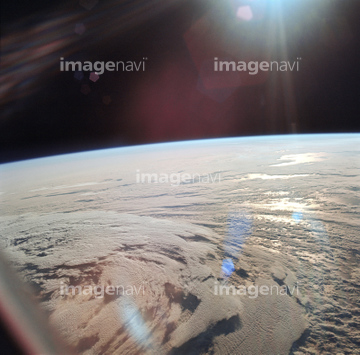
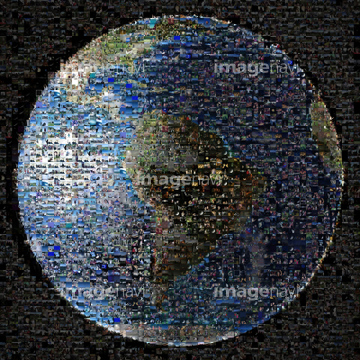
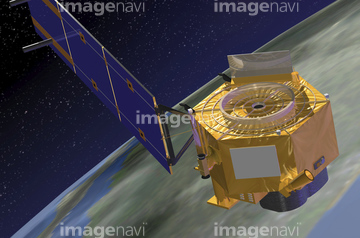
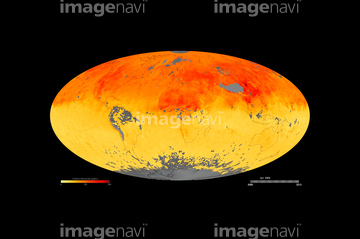
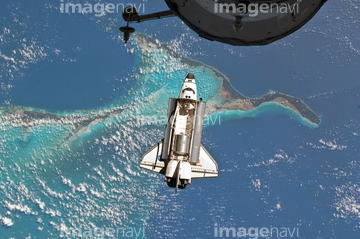
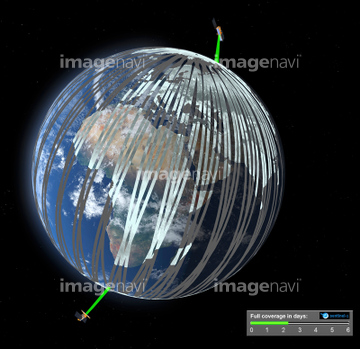
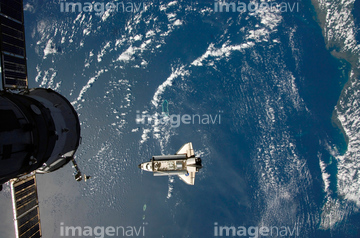
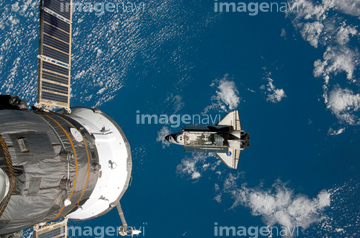
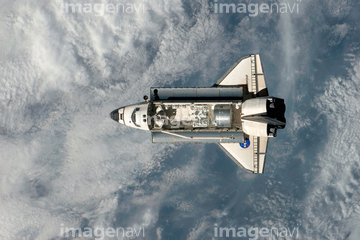
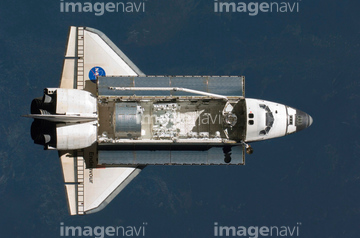
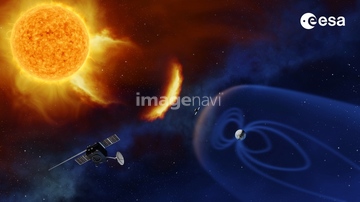
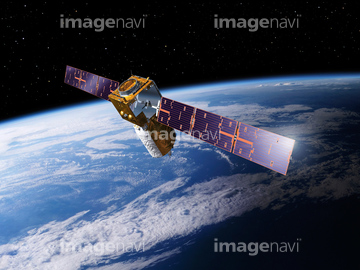
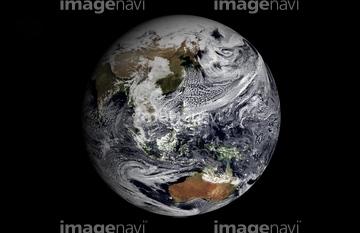
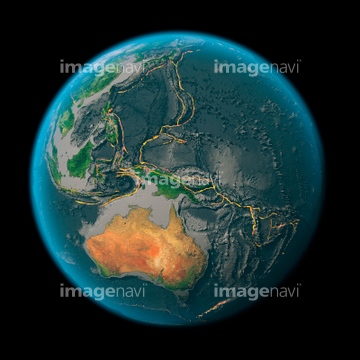
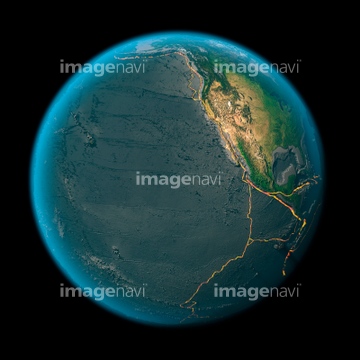
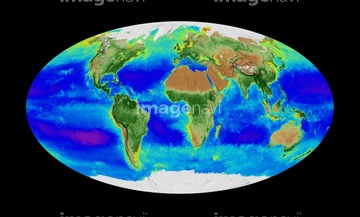
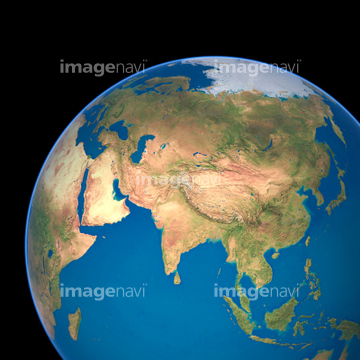
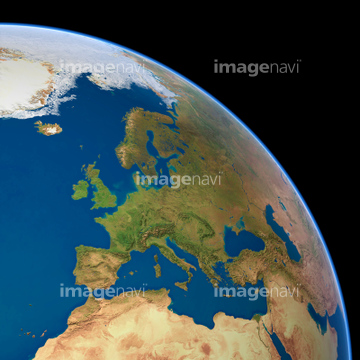
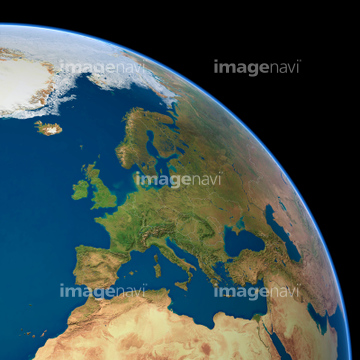
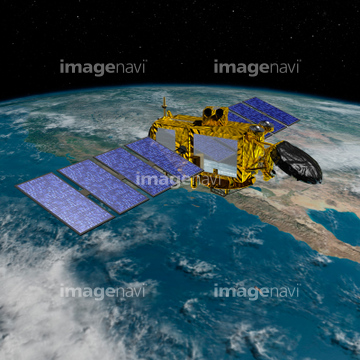
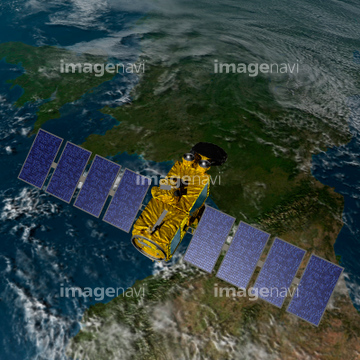
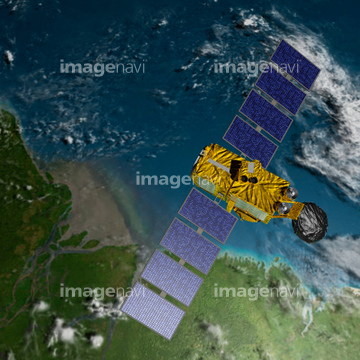
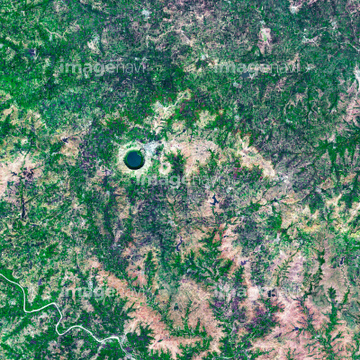
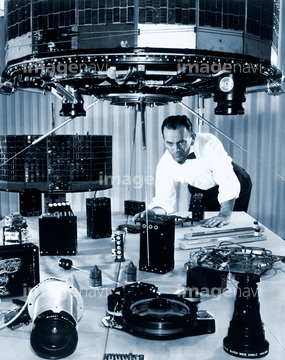
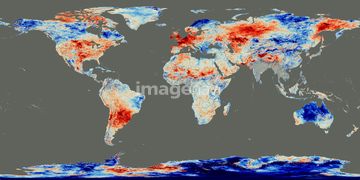
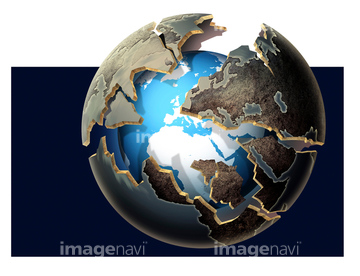
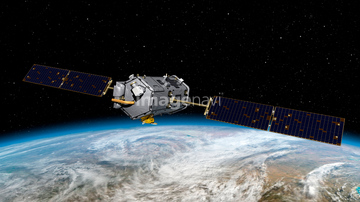
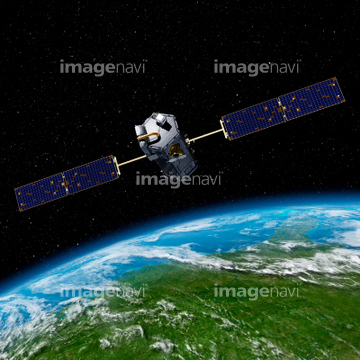
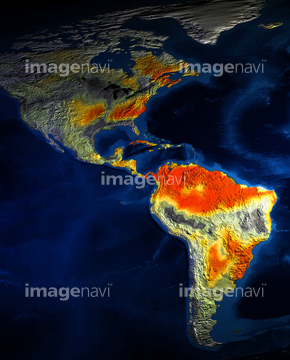
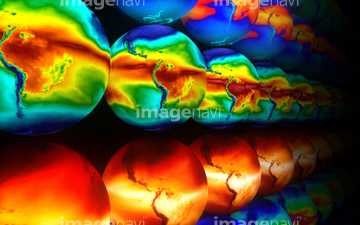
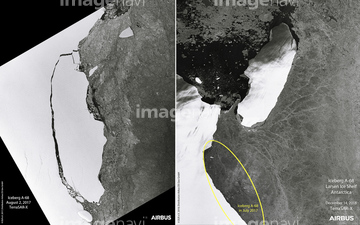
この検索結果には、Australia, satellite image、Soil Moisture Active Passive satellite、Earth, topographic and bathymetric map、Atlantis from the ISS, 2011、NPP satellite in orbit, artwork、LDCM satellite in orbit, artworkなどが含まれています。
64085886
64085885
64078001
64078002
64078003
64078004
64078005
64074871
64173655
64185232
64185233
64185235
64185236
64185237
64185238
64185239
64185240
64185241
64185242
64185243
64185234
64116457
64116458

64041390
64215904
64046391
64109467
64109468
64040007
64040008
64040009
64040010
64040013
64074792
64074793
64086393

64109422
64014574
64053325
64183478

64109527

64109558
64088450
64260979
64011192
64011207
64053596
64053690
64053691
64053692
64040011
64040012
64040014
64040015
64040016
64041383
64066734
64075837
64075839
64075840

64075841
64084875
64084877
64058420
64058421
64087825
64210700
17263842
17263845
17263851
17263853

64116185
64088702
64257529
17200234
64043123
64075838
64220039
64089706
64141450
64162892
64178179
64053599


64041230
64204970
64217602
64097622
64082370
64057614
64040018
64218473
64058334
64109502
64109505
64091493
64065285
64075684
64075594
64075595
64075596
64075597
64168473
64097599
64129763
64085875
64085876
64085877
64085878
64085879
64085880
64206258
64206259
64088667
64263237
64263238
64237590
64024521
64024522
64011918
64123565
64123566
64123567
64123569
64123570
64123571
64170235
64011203
64011211
64011230
64074885
64075591
64088896
64088897
64088898
64090853
64131456
64100576
64075593
64048528
64048529
64048531
64014771
64043836
64043838
64116186
64116187
64116188
64200497
| 次ページ |
