HOME > 写真 > 自然・風景 > 宇宙 > 地球
10,000件の写真素材が検索されました。
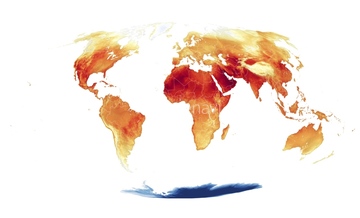
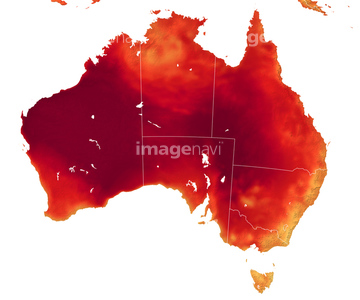
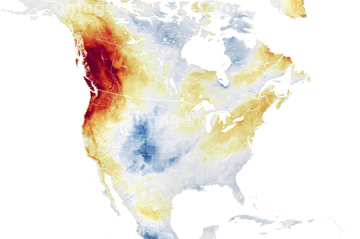
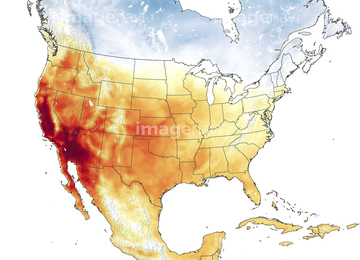
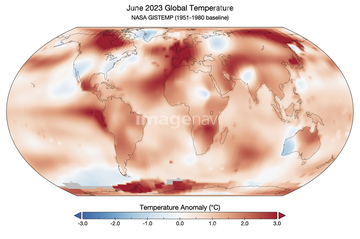
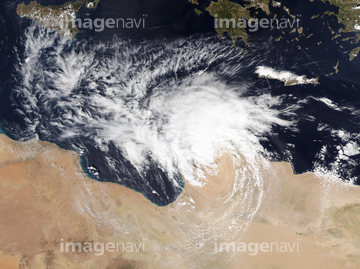
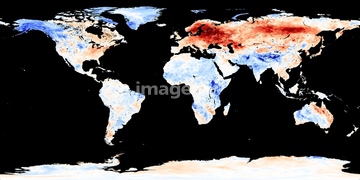
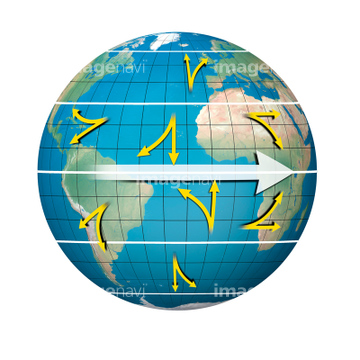
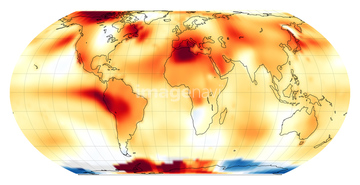
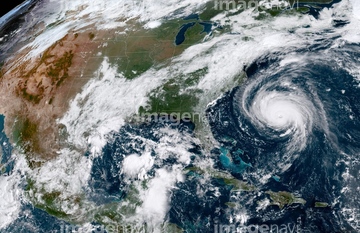
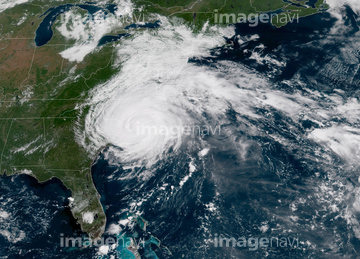
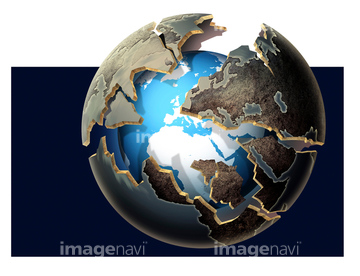
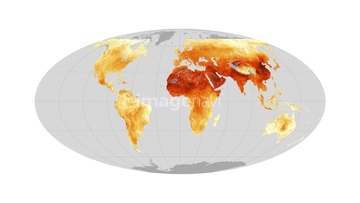
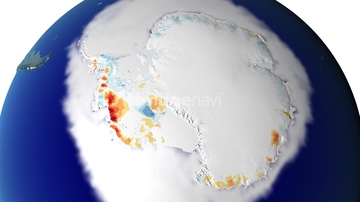
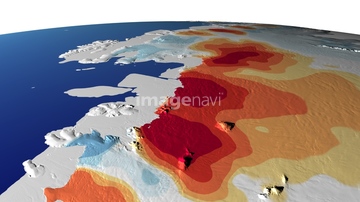
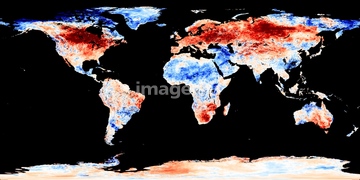
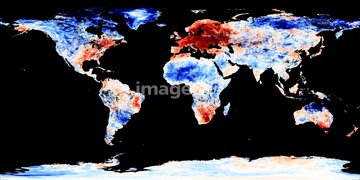
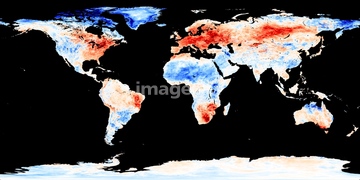
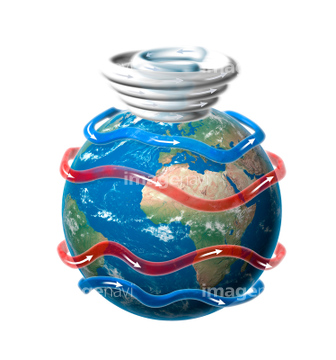
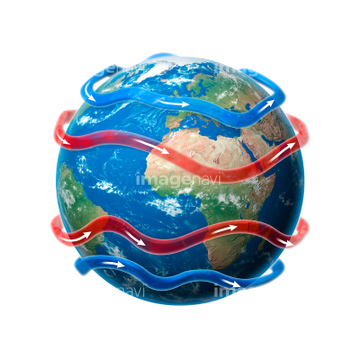
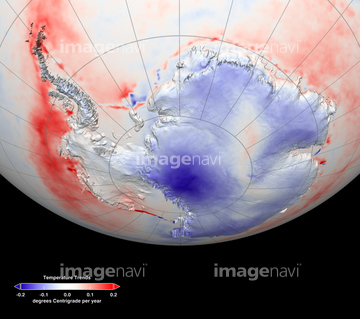
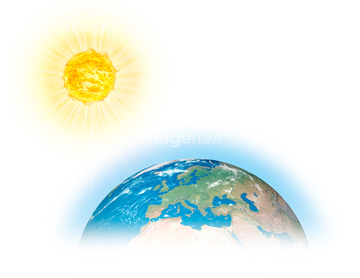
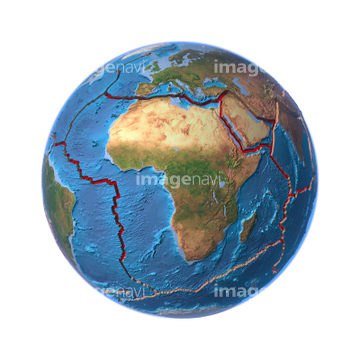
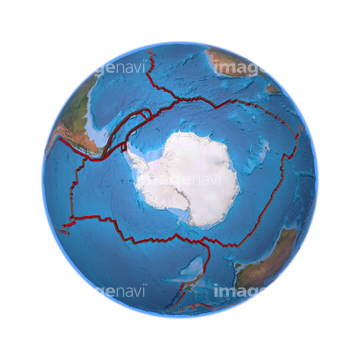
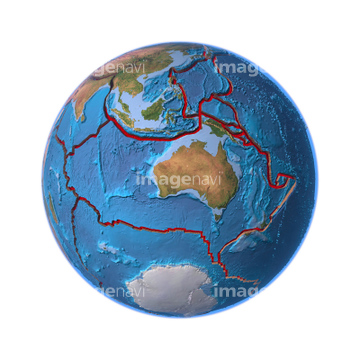
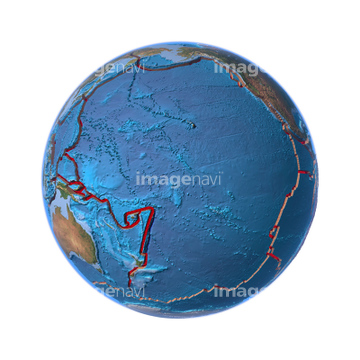
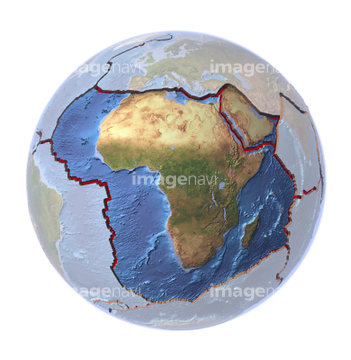
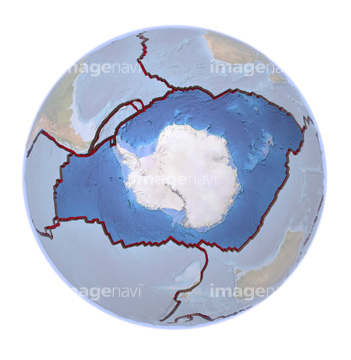
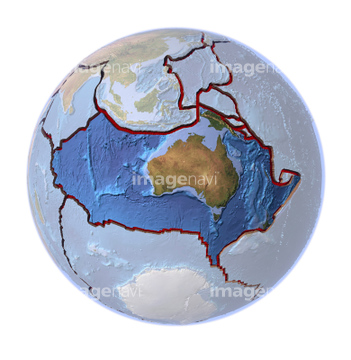
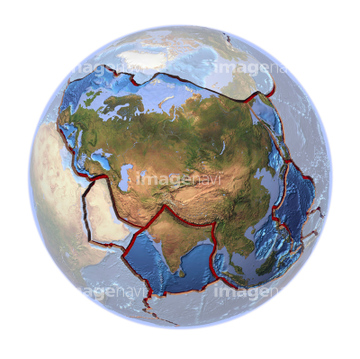
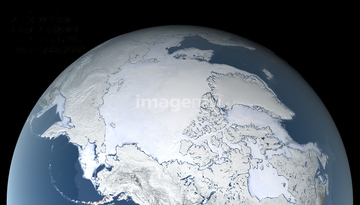
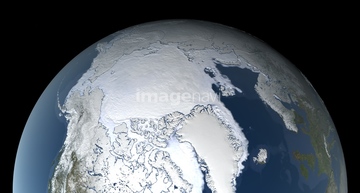
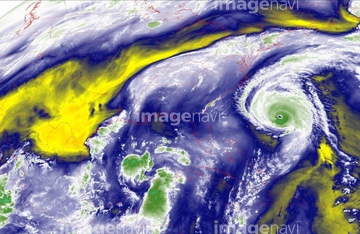
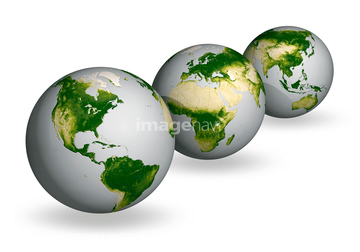
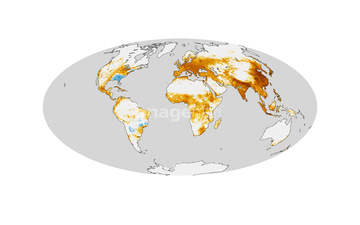
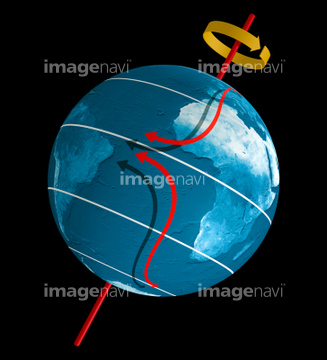
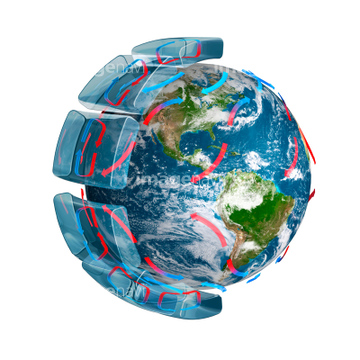
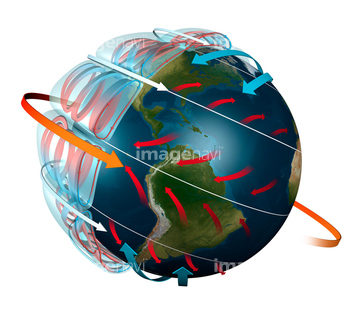
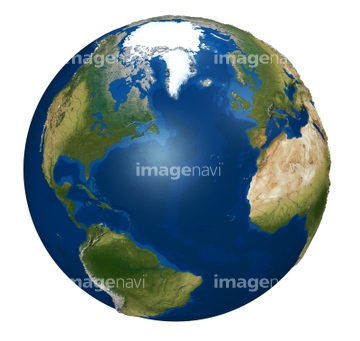
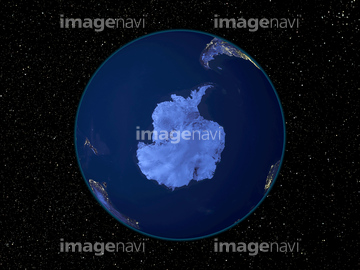
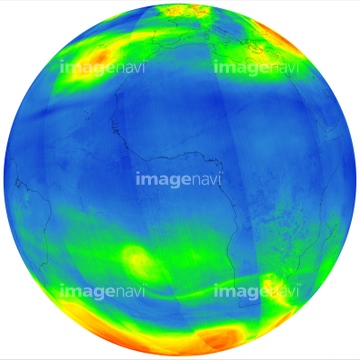
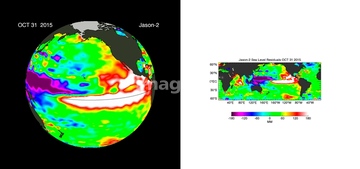
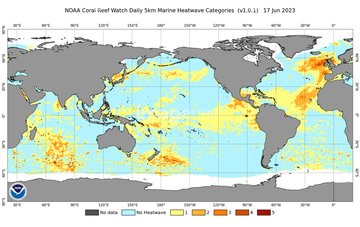
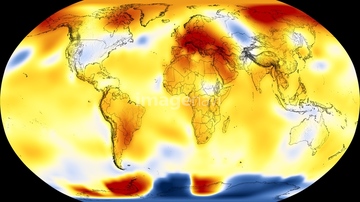
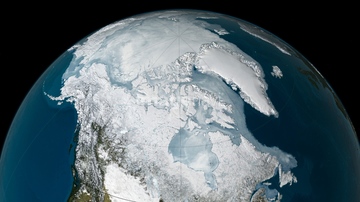
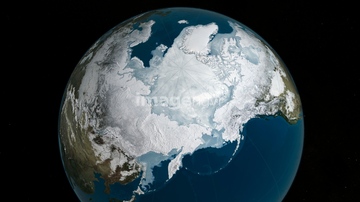
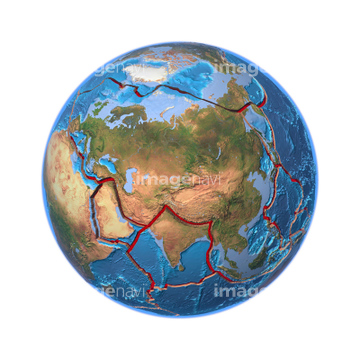
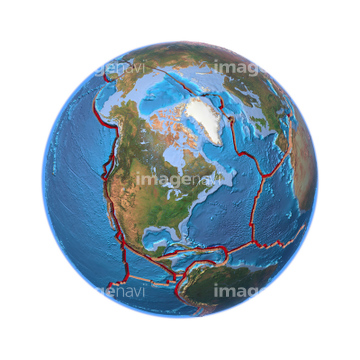
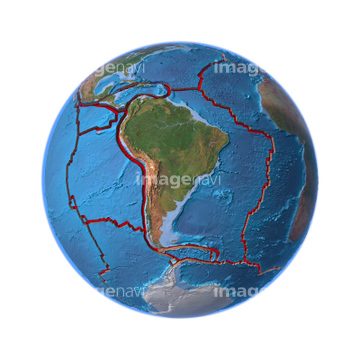
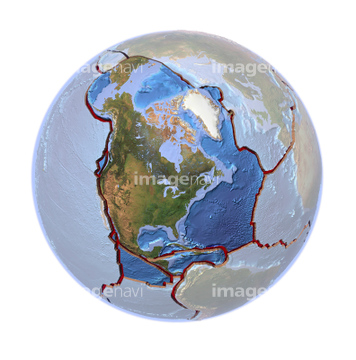
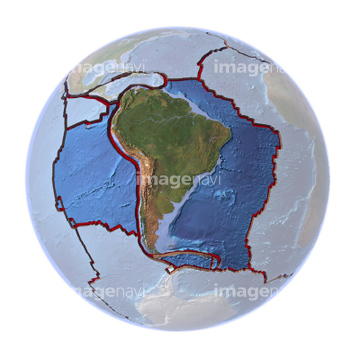
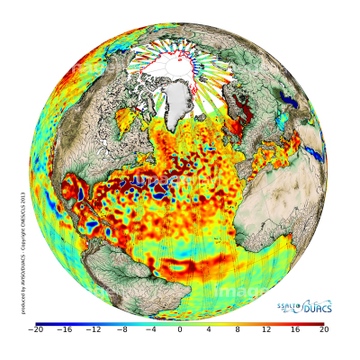
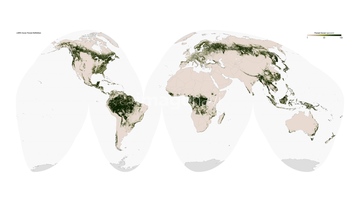
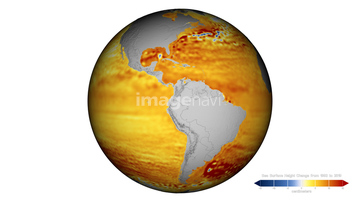
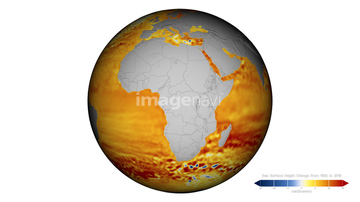
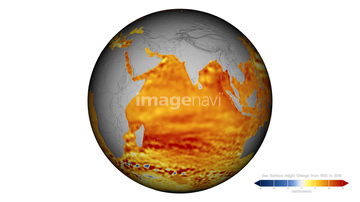
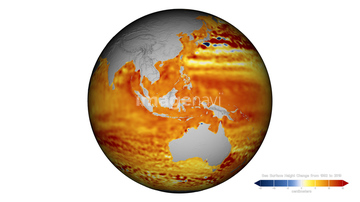
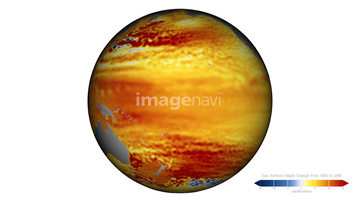
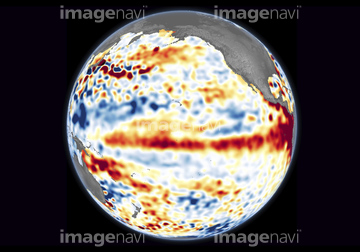
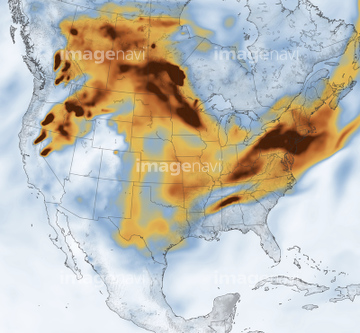
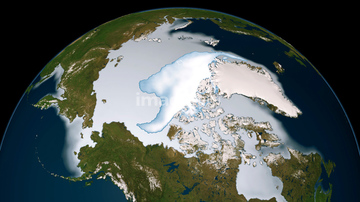
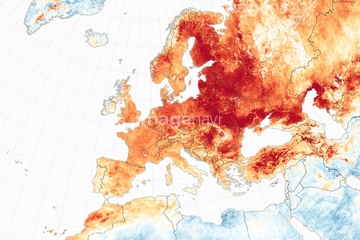
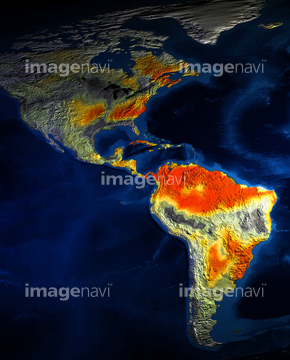
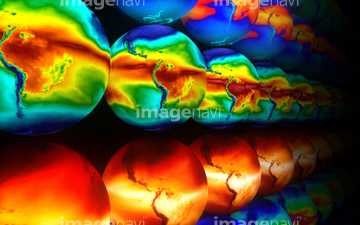
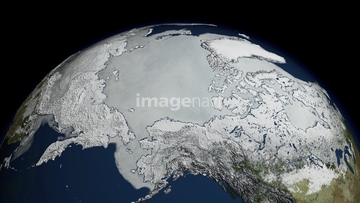
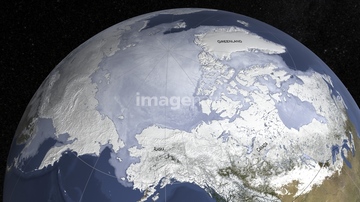
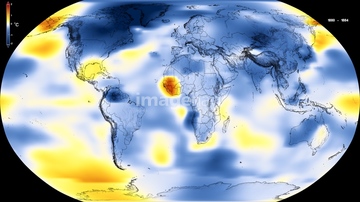
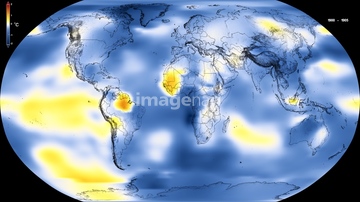
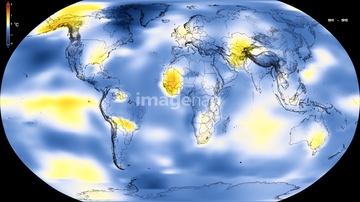
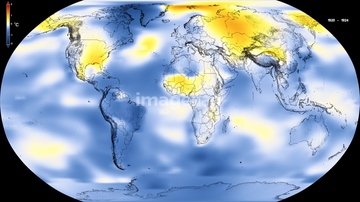
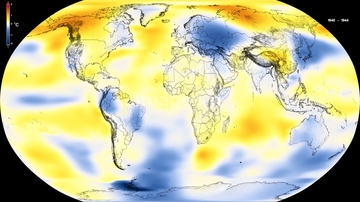
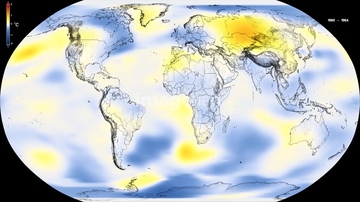
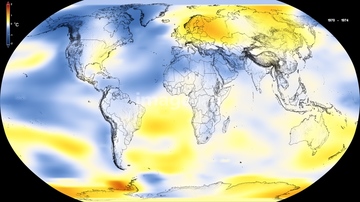
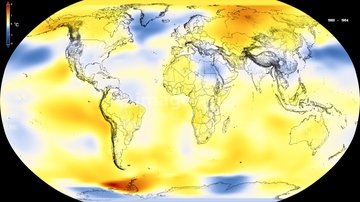
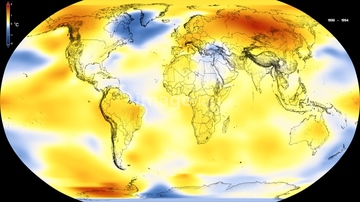
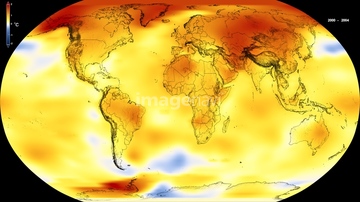
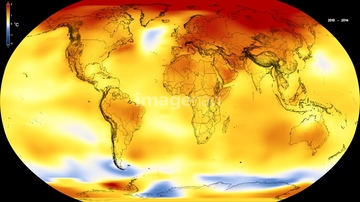
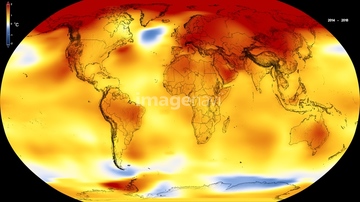
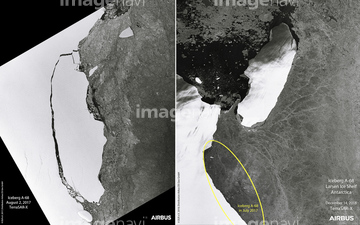
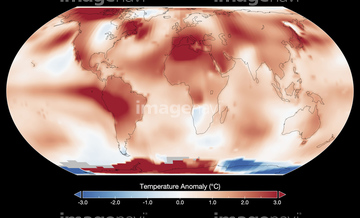
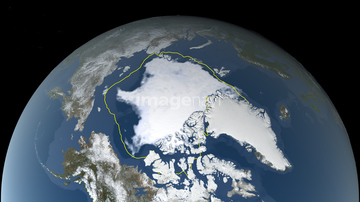
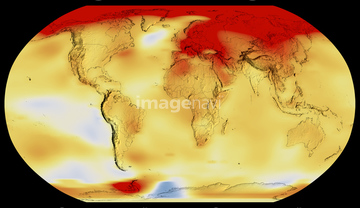
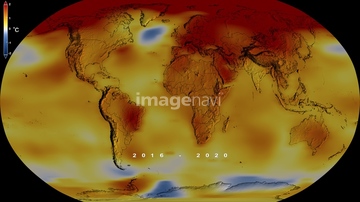
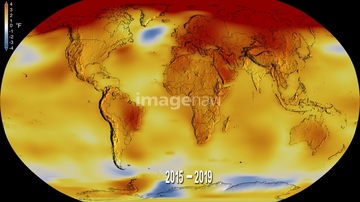
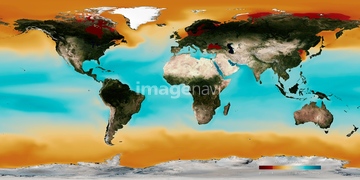
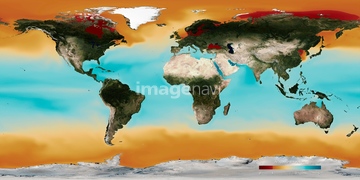
この検索結果には、Global warming record, December 2015、Jet streams, artwork、Antarctic temperature trends, 1982-2003、Global warmig, artwork、Global tectonics, African Plate、Global tectonics, Antarctic Plateなどが含まれています。
64217602
64257529
64203337
64088667
64218100

64217603

64109527

64109558
64169045
64014670

64041390
64088450
64116457
64116458
64060109
64060110
64200497
64067805
64257903
64257904
64192700
64047887
64047888
64169046
64169059

64109509

64109563
64041383
64103757

64109422

64116186
64116187
64116188
64062174
64062175
64071961
64066108
64066109
64066110
64066113
64067274
64067275
64067276
64067277
64067279
64081457
64081459
64081460
64215904
64079777
64200590
64014771
64168208
17262368
17262371
17200256
17200257
17200258
64256566
17262381
64044035
64078166
64078167
64078186
64075792
64085887
64255396
17200249
17200250
17200251
17200253
17200255
64109501
64262548
17266919
64011200
64011203
64011211
64011230
64041384
64058420
64058421
64260979
64204970

64041230
64066111
64219634
64141170
64109562
64253424
64253425
64253426
64253427
64253428
64263237
17262378
17266911
64171614
64140771
21855545
64059717

64109443

64109465
64141450
64162892
64185232
64185233
64185234
64185235
64185236
64185237
64185238
64185239
64185240
64185241
64185242
64185243
64178179
64173143
64173144
64253111
64253112
64075684
64257411

64109439

64109440

64109441

64109442

64109461

64109462

64109463

64109464
64109470
64109471

64109472
| 次ページ |
