HOME > 写真 > 自然・風景 > 宇宙 > 地球
10,000件の写真素材が検索されました。
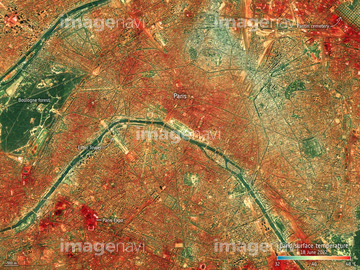
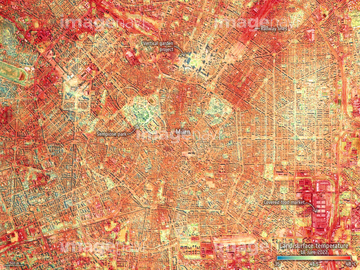
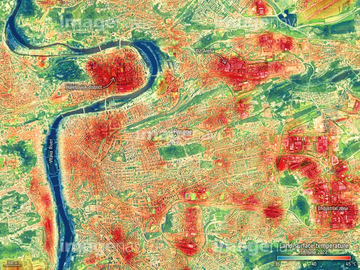
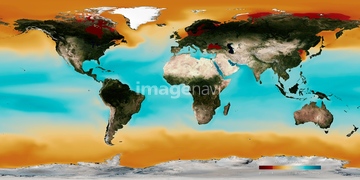
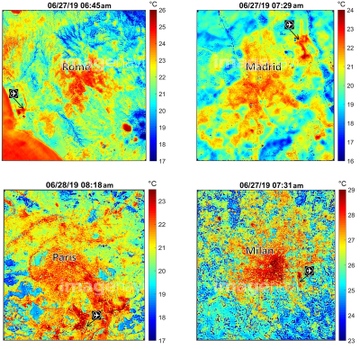
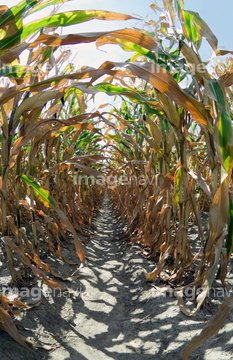
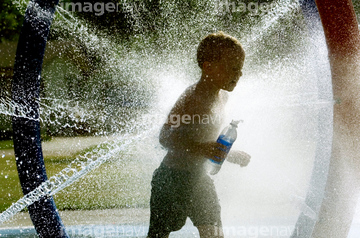
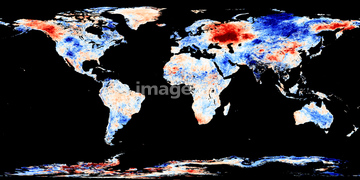
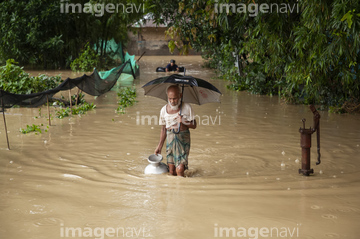
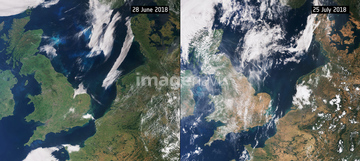
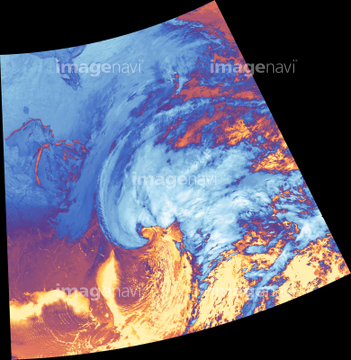
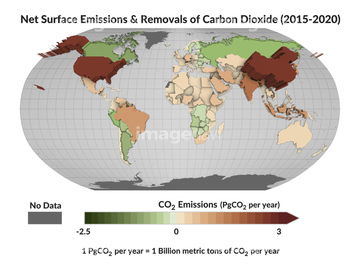
この検索結果には、Ocean-atmosphere CO2 exchange, 2000、Ocean carbonate saturation, 2000、European cities during heatwave of 2019, ECOSTRESS…、Damaged crops during a heatwave、Boy in sprinklers、Boy being sprayed with waterなどが含まれています。
64218100
64262548
64256538
64257529
64203337
64256566

64109509
64217602
64200497
64014773
64257903
64257904
64130289
64217603
64259661
64205161
64010002
64011028
64011029
64109503
64109505
64253111
64253112
64263237
64203129
64011298
64011299

64109439

64109461
64109470
64011300
64011303
64011304
64011305
64011306
64046247

64109527

64109558

64109563
64203130

64109441

64109442

64109463

64109464
64194955
64203141
41523421
41523422
41523423
41523424
41523425
41523426
41523427
41523428
41523429
41523430
41523431
41523432
41523433
41523434
41523435
41523436
41523437
41523438
41523439
64109502
64219636
64116186
64116187
64116188
64201808
00043257
00043258
64186328
64186329
64186330
64186331

64109422

64109440

64109462
64109471

64109473

64109475
17274214
64109433
64109438
64109444
64109460
64219634
64263238
64009586
41100639
41100640
41100641
41100642
64167300
20562554
64259481
64259653
64260710
64045640
64045641
64045643
64045644
64045653
64045654
64045655


64041230

64041390
64092867
64092868
64058420
64058421
64016870
64201796
64201797
64201798
64201799
64014771

64109472
70076144
64109466
64109469

64109443

64109465
64088741
64088743
64088744
64088745
64088746
64088747
64088748
64109560
| 次ページ |
