HOME > 写真 > 自然・風景 > 宇宙 > 地球
10,000件の写真素材が検索されました。
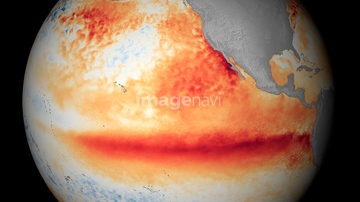
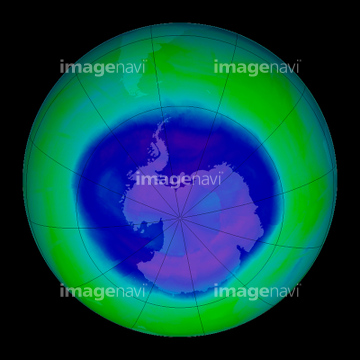
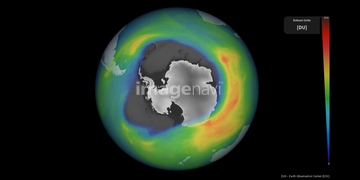
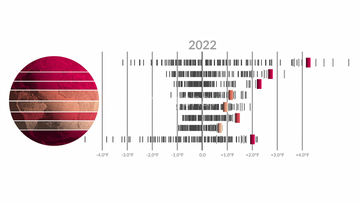
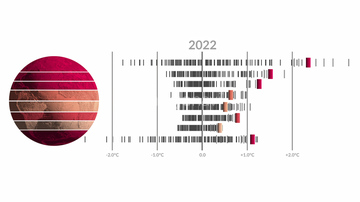
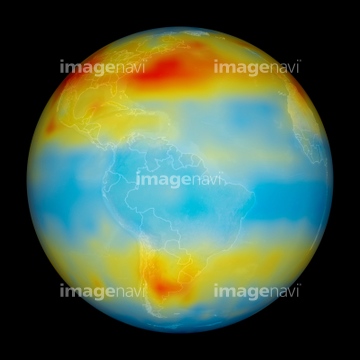
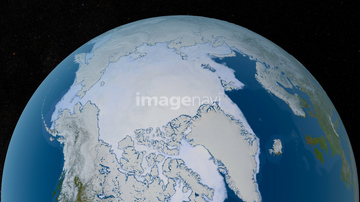
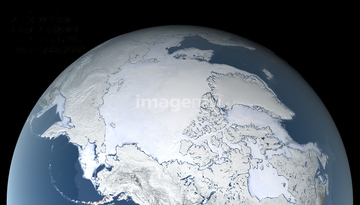
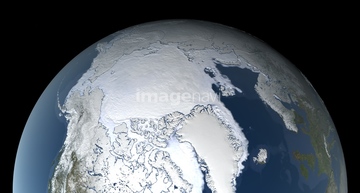
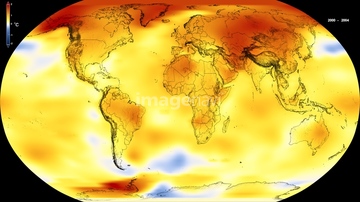
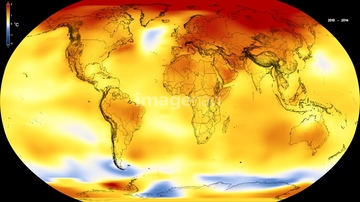
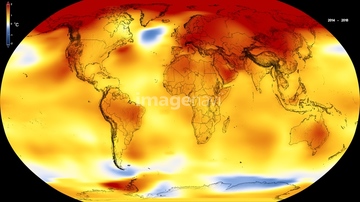
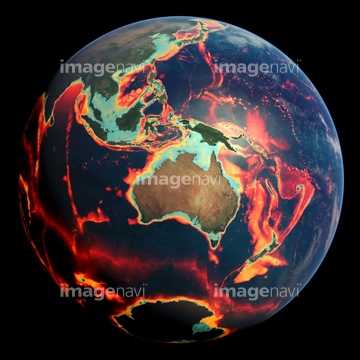
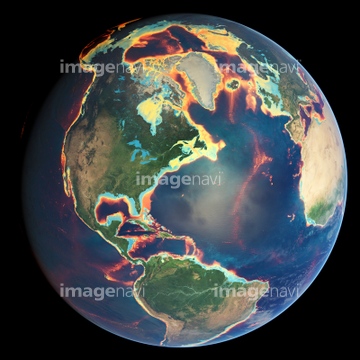
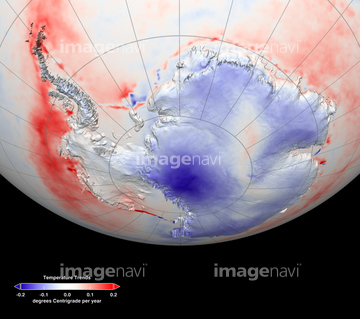
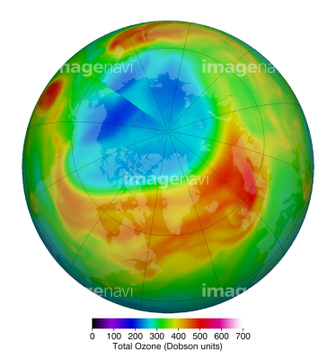
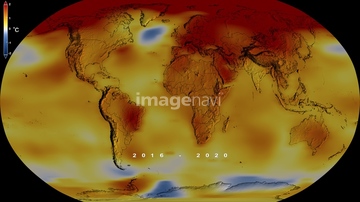
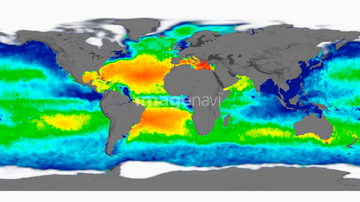
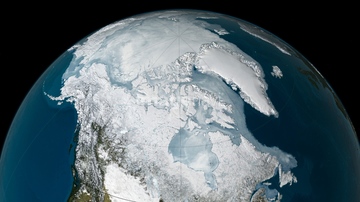
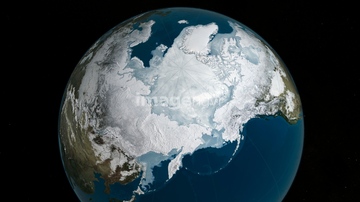
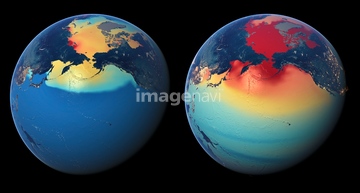
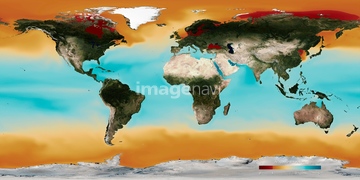
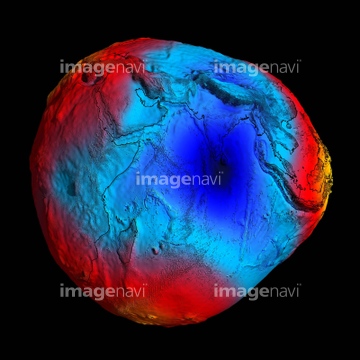
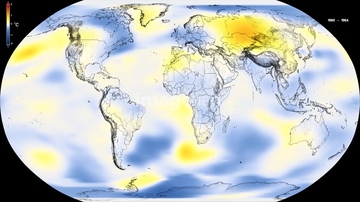
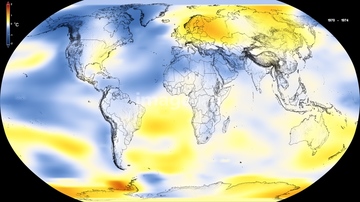
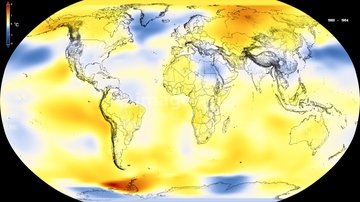
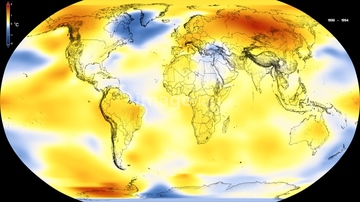
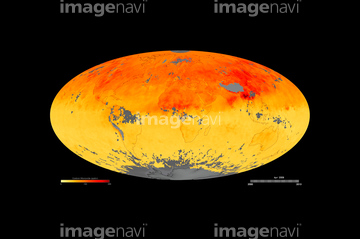
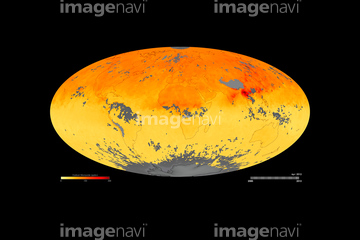
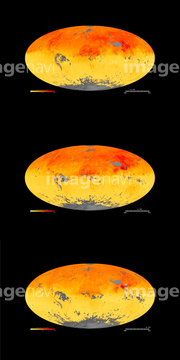
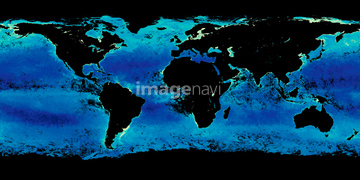
この検索結果には、Global warming record, 2000-2004、Global warming record, 2010-2014、Global warming record, 2014-2018、Indian and Pacific ocean bathymetry、Arctic and North American bathymetry、Antarctic ozone hole maximum, 2022などが含まれています。
64263238
64263237
64109501

64109422
64088667
64011192
64088450

64109527

64109558
64260136
64260979
64206258
64206259
64237590
64257903
64257904
64129763
64047887
64047888

64109563

64053690
64109502
64109505
64204970
64215904
64218100
64203337
20506144
64053325

64109439

64109461
64109470
64185241
64185242
64185243
64105949
64105960
64255396
64109467
64109468
64040980
64067331
64067330
64169045
64141170
64093900
64093902
64200590
64011207
64100576
64121445
64044426
64044427
17200234
64061241
64116457
64116458
64058420
64058421
64044794
64044795
64044796
64041383
64109503
64262469

64109509
64253801

64106283
64011203
64011211
64011214
64011215
64011221
64011223
64011225
64011229
64011230

64011231

64109443

64109465
64212738
64123567
64214737
64121962
17200256
17200257

64109472
64105772
64105944
64106823

64109440

64109441

64109442

64109462

64109463

64109464
64109471

64109473

64109475
64259482
64259490
64168425
64152465
64086443
64049125
64185232
64185233
64185234
64185235
64185237
64185238
64185239
64185240
64218473
64185236
64085875
64085876
64085879
64085880
64085886
64086428
64131456
| 次ページ |
