HOME > 写真 > 自然・風景 > 宇宙 > 地球
10,000件の写真素材が検索されました。
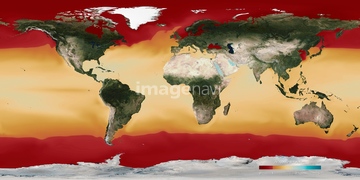
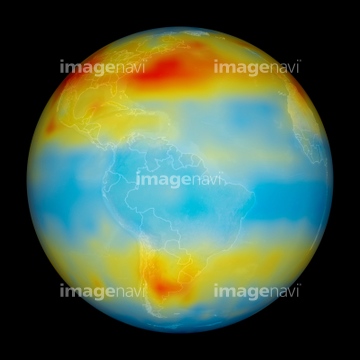
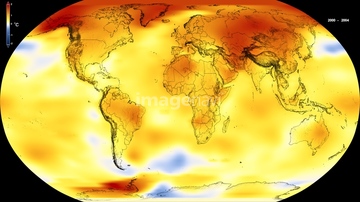
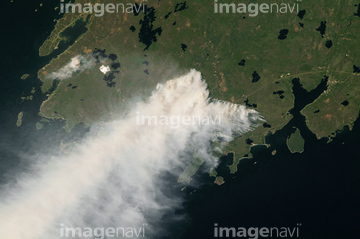
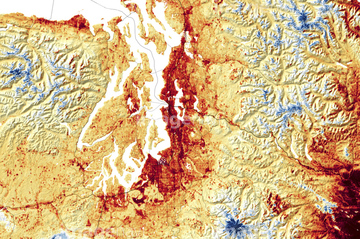
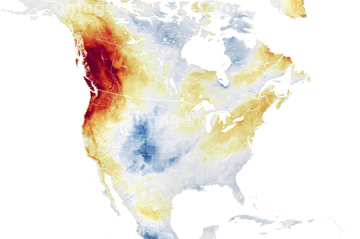
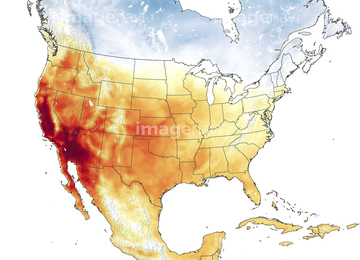
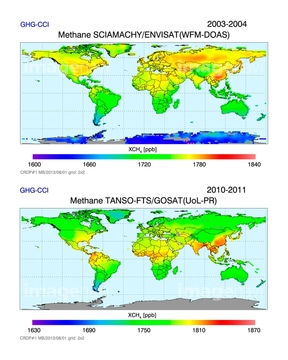
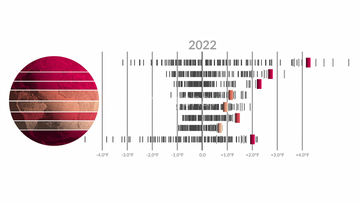
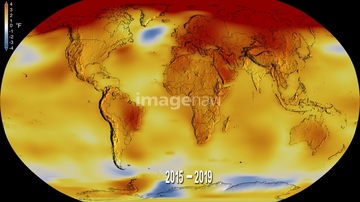
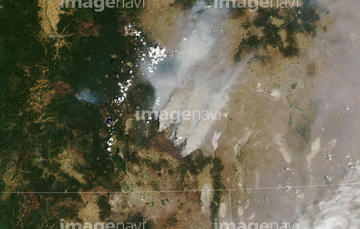
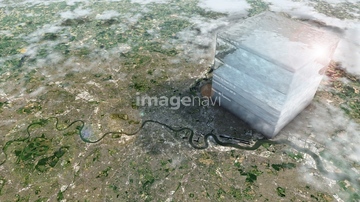
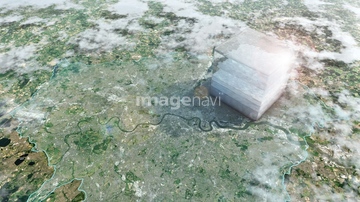
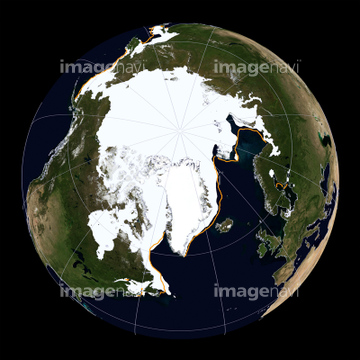
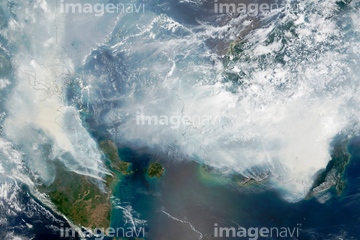
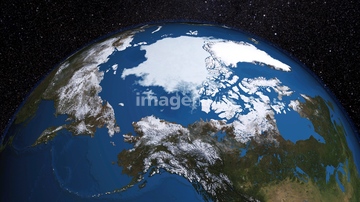
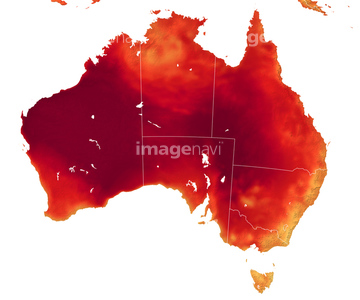
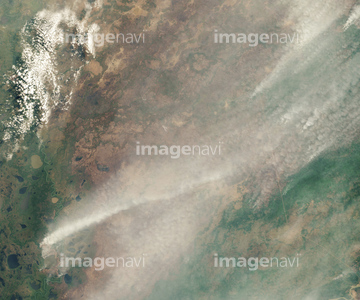
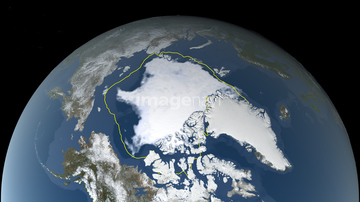
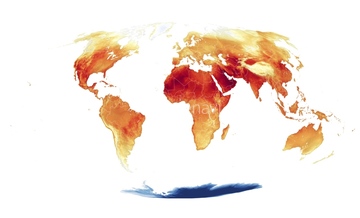
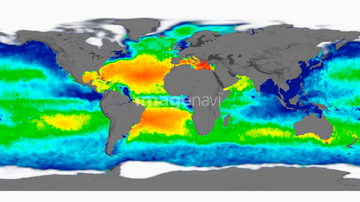
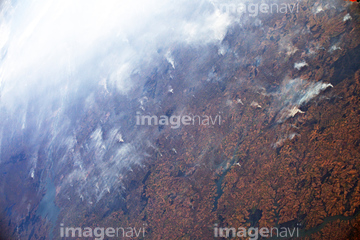
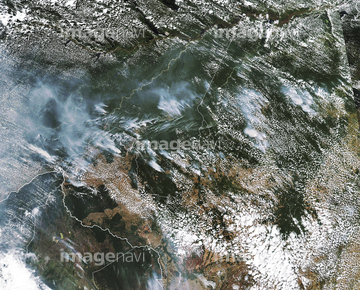
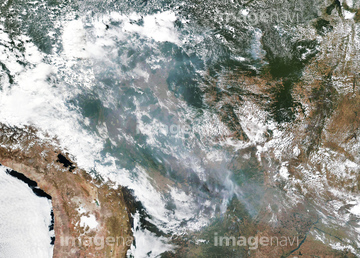
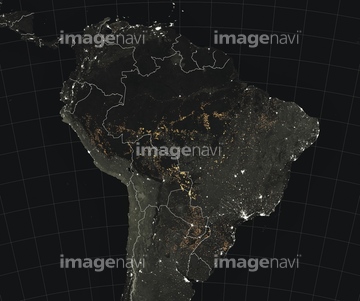
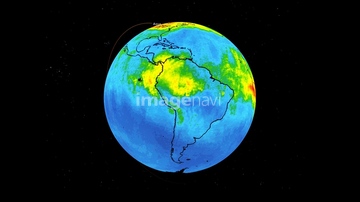
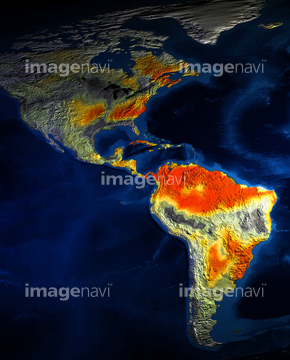
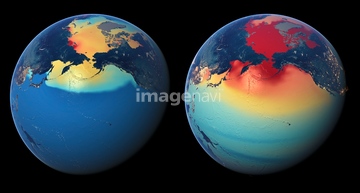
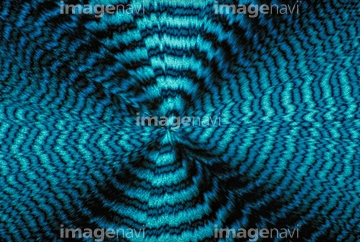
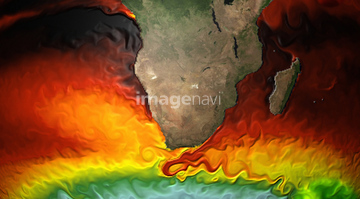
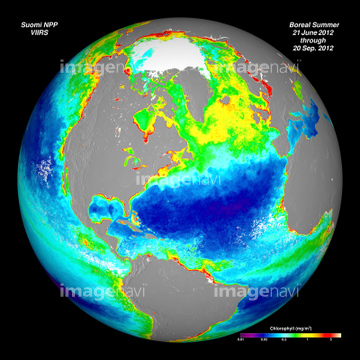
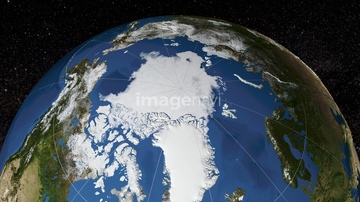
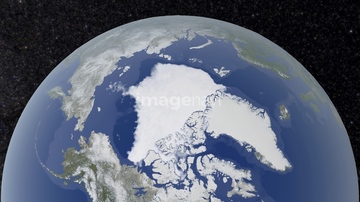
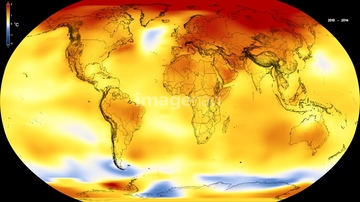
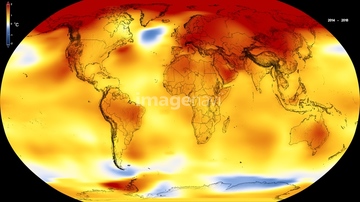
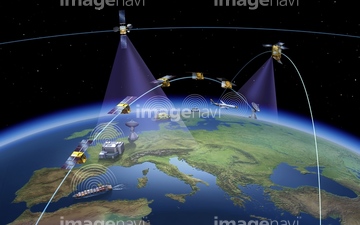
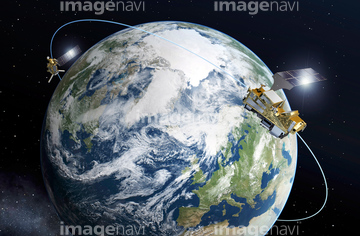
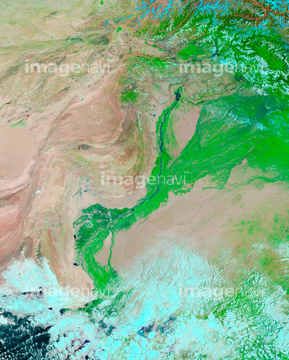
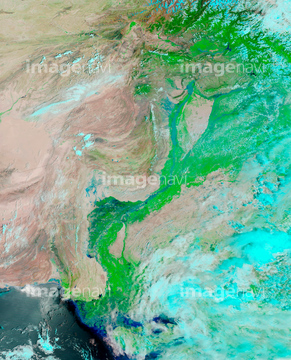
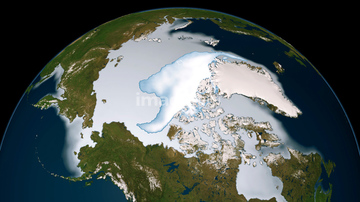
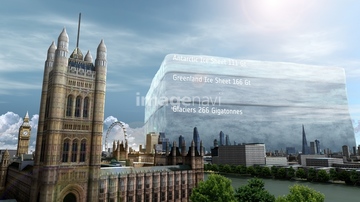
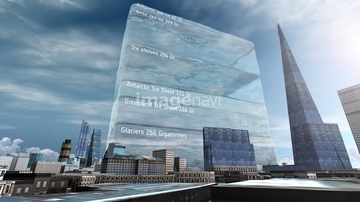
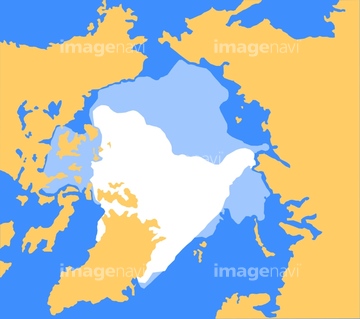
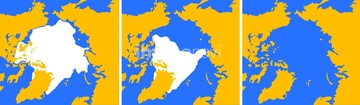
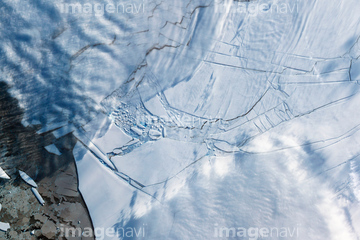
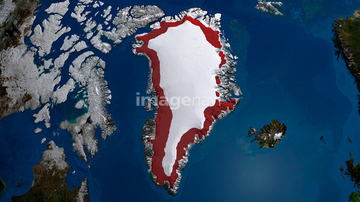
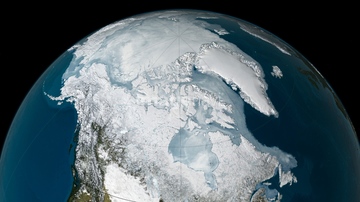
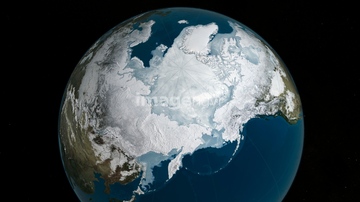
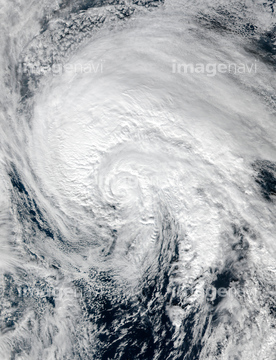
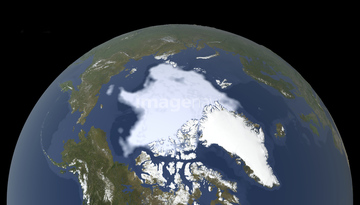
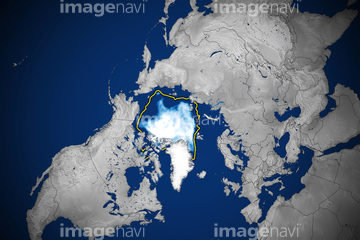
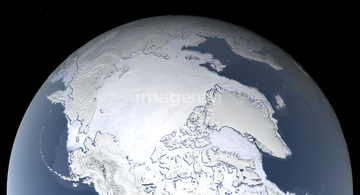
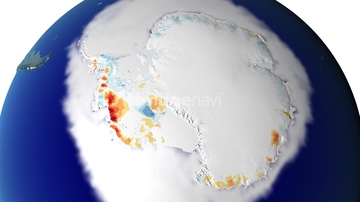
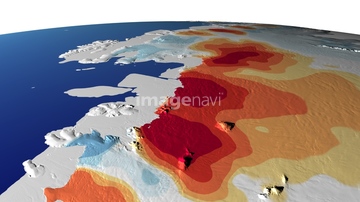
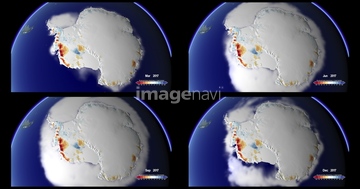
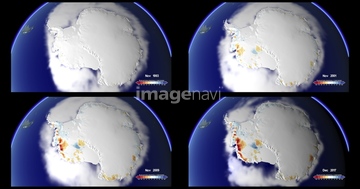
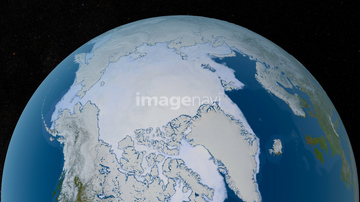
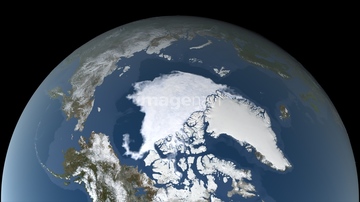
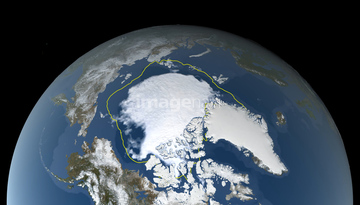
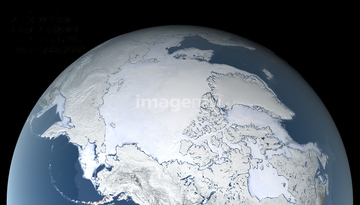
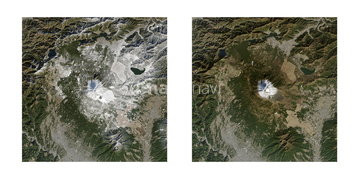
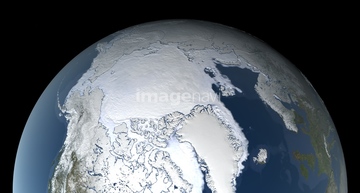
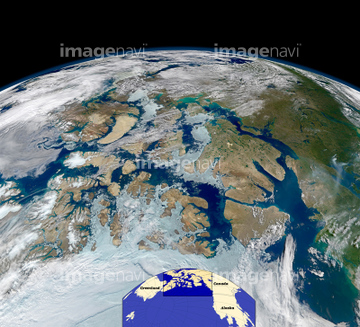
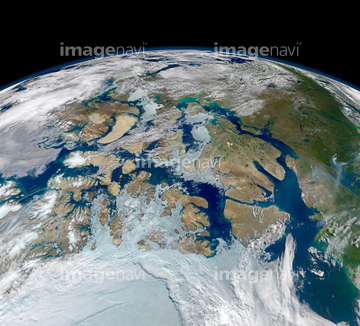
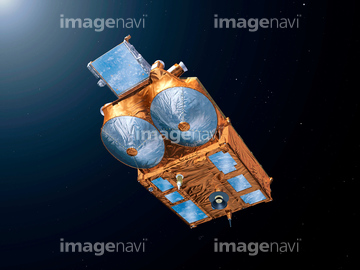
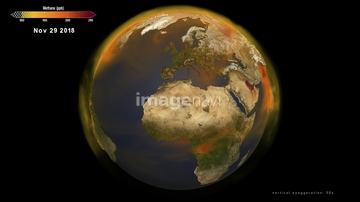
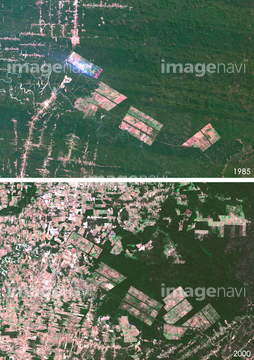
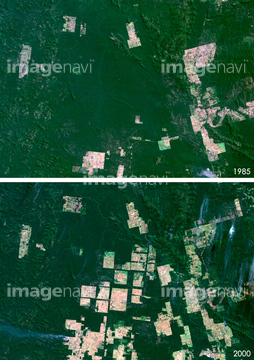
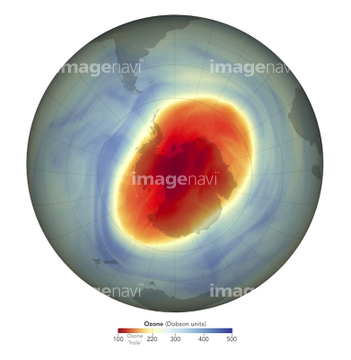
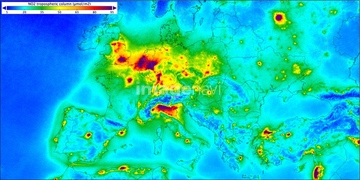
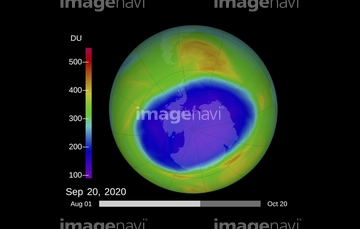
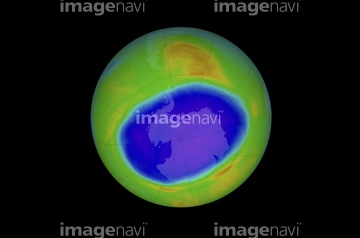
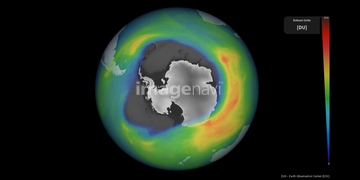
この検索結果には、Annual ice loss compared with London, UK, illustra…、Arctic sea ice maximum, 2014、Indonesian forest fires, 2015、Deep ocean temperature changes、Annual minimum Arctic sea ice, 2015、Australian heatwave, 2022などが含まれています。
64109470
64109466
64109469
64109471

64109472

64109473

64109475
64109476

64109439
64109433
64109438

64109440

64109441

64109442

64109461

64109443
64109444
64109460

64109422

64109462

64109463

64109464

64109465
64109502
64109503
64109505
64185241
64218100
64203337

64109509

64109527

64109558


64109421
64257903
64257904
64192700
64219636

64088450
64109506

64109563
64105772
64257529
64116457
64116458
64064294
64050840
64092867
64262469
64263237
64263238
64011192
64219634
64014574
64093900
64093901
64093902
64109564
64009996
64009999
64010002
64010004
64010006
64257411
64217602
64188515
64188516
64188517
64188518
64105944
64134778

64106283
64091461
64091462
64141170
64131456
64109508
64119316
64154867
64169502
64185242
64185243
64121962
64125447
64109501
64168478
64253228
64097616
64044574
64053690
64053700
64009992
64010000
64010005
64010007
64010100
64040205
64040206
64059717
20543664
20543741
64088702
64092868
64116185
64255401
64257399
64260979
64204970
64204971
64247623
64215904
64058420
64058421
64045640
64045641
64045643
64045644
64045653
64045654
64045655

64041230

64041390
64009994
64208339
64255396
64206258
64206259
64237590
| 次ページ |
